
Bitcoin and most major altcoins are reeling under intense selling, and charts suggest that the market sell-off is not complete.

Bitcoin and most major altcoins are reeling under intense selling, and charts suggest that the market sell-off is not complete.


Bitcoin continues to range trade, and altcoin traders are starting to view BTC’s price consolidation as a positive sign for the rest of the crypto market.

Cardano (ADA) has been at the forefront of network development over the last few months. This continued commitment to further development on the blockchain has led to the network hitting multiple new milestones. However, the price of ADA has remained stagnant, so what’s going on?
The year 2023 has been a good year for the Cardano network so far as it has celebrated multiple achievements during this time. The first of these is the fact that the Cardano network has recorded one of the longest uptimes of any blockchain in the space.
Cardano has recorded a continuous uptime record of 2,131 days as of July 28, which means that the network has not had an outage in almost six years. This achievement points to the sound technology behind the blockchain, in comparison to competitors such as Solana which has been characterized by multiple outages since its launch.
Cardano has a current UPTIME of 2129 days exactly.
That’s 5.83 YEARS with NO downtime.Built to last, an uptime the largest service providers in the world cannot & will never come close to challenging.
Research Wins. We are Cardano. Choose Cardano. 🙌👏@IOHK_Charles @Cardano…
— Dave 🧑🚀💽 🐋 (@beaumont_dvd) July 26, 2023
Another achievement for the network has the consistent development taking place. Cardano has consistently ranked among the top 3 ecosystems when it comes to development and this time around has been no different.
ADA price trending at $0.31 | Source: ADAUSD on TradingView.com
According to data from the on-chain tracker Santiment, the network is number 3 on the list of assets with the most developments over the last 30 days. This puts it behind only Polkadot (DOT) and Kusama Network (KSM), both of which emerged 1st and 2nd, respectively. This placement also puts Cardano ahead of its largest competitor Ethereum in terms of development.
🧑💻 Top 10 #crypto assets by development activity: notable #github commits, past 30 days:
T1 @Polkadot $DOT
T1 @kusamanetwork $KSM
3 @Cardano $ADA
4 @dfinity $ICP
5 @hedera $HBAR
6 @vegaprotocol $VEGA
7 @ethstatus $SNT
8 @cosmos $ATOM
9 @Ethereum $ETH
10 @decentraland $MANA pic.twitter.com/SnWDQf5a3y— Santiment (@santimentfeed) July 27, 2023
Usually, when a network such as Cardano is recording such achievements as it has, it is reflected in the price of its native in the form of a rally. However, there has been no such performance from ADA. Rather, the altcoin has been shedding its gains since June.
The problem may not be from ADA and might stem from the fact that the crypto market just reverted into another bear market trend. As a result, the broader market has been following the movement of Bitcoin, which on its own has reversed toward the low $29,000s.
Given Cardano’s developments, if the market were to resume its rally, then ADA may emerge as one of the top performers. This would stem from the positive sentiment surrounding the token due to its significant achievements.
Meanwhile, ADA is still performing well on a broader scale. At its current price, the digital asset’s price is up over 40% from its June lows, and ADA holding a good chunk of these gains shows that demand is rising to meet supply, thereby steadying the price.

Bitcoin remains stuck inside a narrow range, making it difficult to predict the direction of the next possible breakout. The U.S. Dollar Index (DXY), which generally moves in inverse correlation to Bitcoin (BTC), dropped below 100, but that has failed to propel Bitcoin higher. This suggests that Bitcoin is charting its own course in the near term.
Therefore, the earnings season from big companies this week may sway equities markets in the United States but may not have the same effect on Bitcoin. It is becoming increasingly difficult to pinpoint the event or the news flow that will cause Bitcoin’s price to escape the range.

The uncertainty about Bitcoin’s next directional move has not deterred the whales. CryptoQuant’s contributing analyst SignalQuant highlighted that one on-chain indicator, the unspent transaction outputs, has been rising in 2023, similar to the increase seen in 2019. If the indicator continues to rise, it will suggest that Bitcoin has room to run and the low made in late 2022 was a long-term bottom.
Could the DXY stage a recovery? Will that limit the upside in Bitcoin and the major altcoins? Let’s analyze the charts to find out.
The S&P 500 Index (SPX) is in a strong uptrend. The price has reached resistance at 4,513, which may act as a minor hurdle. But if bulls do not give up much ground from the current levels, it will suggest that traders expect the rally to continue.

The developing negative divergence on the relative strength index (RSI) has been negated, indicating that the bulls remain in command. If buyers thrust and sustain the price above 4,513, the index could resume its uptrend and reach 4,650. This level may again act as a strong barrier.
On the way down, the 20-day exponential moving average (EMA) of 4,420 is the important support level to watch out for. If this support gives way, it will signal that the bulls may be booking profits. That may sink the price to the 50-day simple moving average (SMA) of 4,293.
The U.S. Dollar Index broke below the moving averages on July 7 and continued its downward spiral. The bears yanked the price below the vital support at 100.82 on July 12, completing a bearish descending triangle pattern.

The sharp fall of the past few days has sent the RSI into the oversold territory, indicating that a minor recovery is possible. If the price turns up from the current level, the index could retest the breakdown level of 100.82.
This remains the key level to watch for. If the price turns down from this level, it will suggest that the bears have flipped the previous support into resistance. That could start a downtrend, which could reach 97 and then collapse toward the pattern target of 93.64.
If bulls want to prevent the decline, they will have to quickly push and maintain the price above 100.82.
Bitcoin bulls have defended the 20-day EMA ($30,173) for the past three days, but a negative sign is that they have failed to start a strong bounce off it. This suggests a lack of aggressive demand at current levels.

The 20-day EMA has started to flatten out and the RSI is just above the midpoint, indicating a balance between supply and demand. That could keep the pair inside the tight range of $29,500 and $31,500 for a while longer.
Buyers will have to shove the price above $32,400 to signal the start of the next leg of the uptrend. The BTC/USDT pair could then surge toward $40,000. Instead, if the price tumbles below $29,500, the pair may skid to the 50-day SMA ($28,671).
Ether (ETH) is trying to maintain above the 20-day EMA ($1,897), suggesting that the lower levels are attracting buyers.

The bulls will try to push the price to the psychological resistance of $2,000. This remains the key level to keep an eye on because a break and close above it will clear the path for a possible rally to the $2,141 to $2,200 zone.
The crucial support to watch on the downside is the 50-day SMA ($1,853). If this level cracks, it will suggest that the ETH/USDT pair may remain inside the large range between $1,626 and $2,000 for some more time.
XRP (XRP) is finding support in the zone between the 50% Fibonacci retracement level of $0.69 and the 61.8% retracement level of $0.64.

The bulls will try to resume the up move, but they may face formidable resistance at $0.83 and again at $0.93. If the price turns down from this zone, the XRP/USDT pair may remain stuck inside a range for a few days.
Another possibility is that the price turns down from the current level and breaks below $0.64. If that happens, it will signal an urgency among the bulls to exit their positions. That could sink the pair to the 20-day EMA ($0.58).
BNB (BNB) turned down from the 50-day SMA ($253) and reentered the symmetrical triangle pattern on July 14. This shows that the bears are fiercely defending the overhead resistance at $265.

The 20-day EMA ($244) has flattened out and the RSI is just below the midpoint, indicating a balance between supply and demand. The BNB/USDT pair could oscillate inside the triangle for a few more days.
Buyers will have to propel and maintain the price above the triangle to gain the upper hand. The momentum could pick up after the bulls kick the price above the overhead resistance at $265. Alternatively, a break below the triangle will signal that the bears are back in the driver’s seat. The pair could resume its downtrend below $220.
Solana (SOL) formed an inside-day candlestick pattern on July 15 and 16, which suggests short-term uncertainty about the next directional move.

Generally, the tightening of the range is followed by a sharp breakout. If buyers thrust the price above $29.12, the SOL/USDT pair could jump to $32.13. A rally above this level could open the doors for a further rise to $38.
Contrarily, if the price turns down and plunges below $26, it will suggest that the advantage has tilted in favor of the bears. The pair could first slide to $24 and thereafter to the 20-day EMA ($22.53).
Related: Bitcoin ‘full breakout’ not here yet as BTC price spends month at $30K
Cardano’s (ADA) pullback has reached near the breakout level of $0.30. Usually, such a deep correction delays the start of the next leg of the up move.

However, the moving averages are about to complete a bullish crossover and the RSI is in the positive territory, indicating that bulls have a slight edge. If the price turns up from the current level, buyers will again try to drive the ADA/USDT pair to the overhead resistance at $0.38.
It is unlikely to be an easy path higher for the bulls. The bears will try to stall the recovery at $0.34 and again at $0.36. On the downside, a break and close below $0.30 could tilt the advantage in favor of the bears.
Dogecoin (DOGE) is witnessing a tough battle between the bulls and the bears near the overhead resistance at $0.07.

The 20-day EMA ($0.07) has started to turn up and the RSI is in the positive territory. This suggests that the bulls have a slight edge. The bulls will try to propel the price to $0.08, where the bears may again mount a strong defense.
Contrary to this assumption, if the price turns down and breaks below the moving averages, it will suggest that bears continue to sell on rallies. That could keep the DOGE/USDT pair stuck inside the $0.06 to $0.07 range for some more time.
Usually, the price turns down and retests the breakout from a pattern, and Polygon (MATIC) is doing just that. The price could drop to $0.72.

If the price rebounds off $0.72 with strength, it will suggest buying at lower levels. The bulls will then try to push the price above the overhead resistance of $0.90. If they do that, the MATIC/USDT pair could start the next leg of the up move. The first stop could be the psychological resistance of $1 and subsequently $1.20.
This positive view will be invalidated if the price continues lower and plummets below the uptrend line. The pair could then slump to $0.60.
This article does not contain investment advice or recommendations. Every investment and trading move involves risk, and readers should conduct their own research when making a decision.


Bitcoin and several altcoins are taking a breather after the sharp rally of the past two days, but the general trend remains bullish.


Bitcoin continues to face strong resistance at $31,000, but supportive macroeconomic factors could tilt the advantage in favor of the bulls.

Bitcoin and select altcoins are finding buyers at lower levels, indicating a pick-up in positive sentiment.


The rejection of ETF applications by the SEC caused a knee-jerk reaction, but the shallow fall in Bitcoin and several altcoins suggests that lower levels are attracting buyers.

Cryptocurrency-friendly neobank Revolut is next to delist a batch of digital assets on its platform in the United States amid the ongoing regulatory developments in the country.
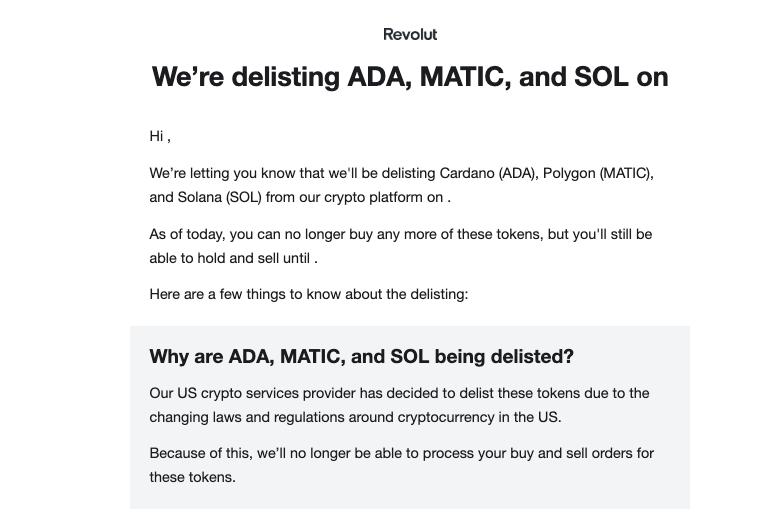
Revolut is preparing to completely delist tokens like Cardano (ADA), Polygon (MATIC) and Solana (SOL) from its platform in September, a spokesperson for the firm told Cointelegraph.
On June 29, Revolut notified its U.S. customers about the change, stating that buying ADA, MATIC and SOL is immediately closed for all customers. Revolut users will still be able to hold and sell these tokens until Sept. 18, the representative noted.
“Any remaining tokens will be sold on your behalf using the market price at the time of sale. We’ll deposit the USD proceeds into your Revolut account,” the firm wrote in the announcement to U.S. customers.
Revolut said that the tokens are being delisted due to developments in its U.S. infrastructure.
“Our U.S. crypto services provider has decided to delist these tokens due to the changing laws and regulations around cryptocurrency in the United States,” Revolut stated.
A spokesperson for Revolut emphasized that the firm still supports the ADA, MATIC and SOL in other jurisdictions outside the United States, stating:
“There are no plans to delist these tokens in other markets, where they remain available.”
The representative also told Cointelegraph that the amount of supported cryptocurrencies on Revolut varies a lot per location. “The European Economic Area plus the United Kingdom have over 115 cryptocurrencies and the U.S. has over 33,” the spokesperson said.
Related: Era of trading crypto as non-securities is over, says exchange exec
Revolut is not alone in delisting these particular three tokens. Companies like Robinhood, eToro and Bakkt all announced ADA, MATIC and SOL delistings over the past few weeks, immediately halting purchases.
As previously reported, ADA, MATIC and SOL were labeled as unregistered securities by the U.S. Securities and Exchange Commission in early June. The allegations came as part of two different actions against major cryptocurrency exchanges, Binance and Coinbase.
Magazine: Asia Express: Huobi sues … Huobi? 3AC rises from ashes, Korea crypto contagion
Disclaimer: This article was updated to show that Revolut US has 33 tokens listed on its platform, instead of 90.


Bitcoin price looks ready to turn $31,000 to support, and many altcoins are following with double-digit gains.
