Higher U.S. inflation is dashing investors’ hopes for multiple Federal Reserve rate cuts this year, while opening the door to 5% Treasury yields across the board and cleaving the stock market into distinct categories of winners and losers.
Source link
fresh
BNB price is attempting a fresh increase from the $545 zone. The price could gain bullish momentum if it clears the $585 and $590 resistance levels.
- BNB price started a fresh increase after it found support near the $545 zone.
- The price is now trading above $560 and the 100 simple moving average (4 hours).
- There is a key contracting triangle forming with resistance near $585 on the 4-hour chart of the BNB/USD pair (data source from Binance).
- The pair could attempt a fresh rally if it clears the $590 resistance zone.
BNB Price Eyes Fresh Surge
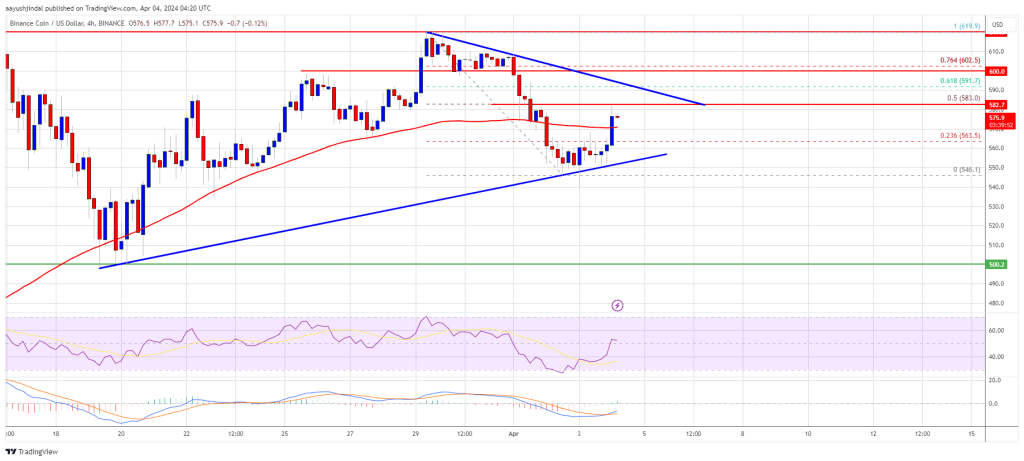
After a downside correction from $620, BNB price found support near the $545 zone. A low was formed at $546.1 and the price started a fresh increase, unlike Ethereum and Bitcoin.
There was a move above the $560 and $565 resistance levels. The bulls pushed the price above the 23.6% Fib retracement level of the downward move from the $619 swing high to the $546 low. The price is now trading above $560 and the 100 simple moving average (4 hours).
Immediate resistance is near the $585 level. There is also a key contracting triangle forming with resistance near $585 on the 4-hour chart of the BNB/USD pair. It is close to the 50% Fib retracement level of the downward move from the $619 swing high to the $546 low.
Source: BNBUSD on TradingView.com
The next resistance sits near the $590 level. A clear move above the $590 zone could send the price further higher. In the stated case, BNB price could test $620. A close above the $620 resistance might set the pace for a larger increase toward the $640 resistance. Any more gains might call for a test of the $700 level in the coming days.
Another Decline?
If BNB fails to clear the $590 resistance, it could start another decline. Initial support on the downside is near the $555 level and the trend line.
The next major support is near the $545 level. The main support sits at $532. If there is a downside break below the $532 support, the price could drop toward the $500 support. Any more losses could initiate a larger decline toward the $465 level.
Technical Indicators
4-Hours MACD – The MACD for BNB/USD is gaining pace in the bullish zone.
4-Hours RSI (Relative Strength Index) – The RSI for BNB/USD is currently above the 50 level.
Major Support Levels – $555, $545, and $532.
Major Resistance Levels – $585, $590, and $620.
Disclaimer: The article is provided for educational purposes only. It does not represent the opinions of NewsBTC on whether to buy, sell or hold any investments and naturally investing carries risks. You are advised to conduct your own research before making any investment decisions. Use information provided on this website entirely at your own risk.
Bitcoin price is rising and now trading above $70,000 resistance zone. BTC could continue to rise toward the $73,000 and $75,000 levels in the near term.
- Bitcoin price remained in a positive zone above the $66,500 level.
- The price is trading above $70,000 and the 100 hourly Simple moving average.
- There is a connecting bullish trend line forming with support at $67,500 on the hourly chart of the BTC/USD pair (data feed from Kraken).
- The pair could continue to rise if it clears the $71,200 resistance zone.
Bitcoin Price Restarts Increase
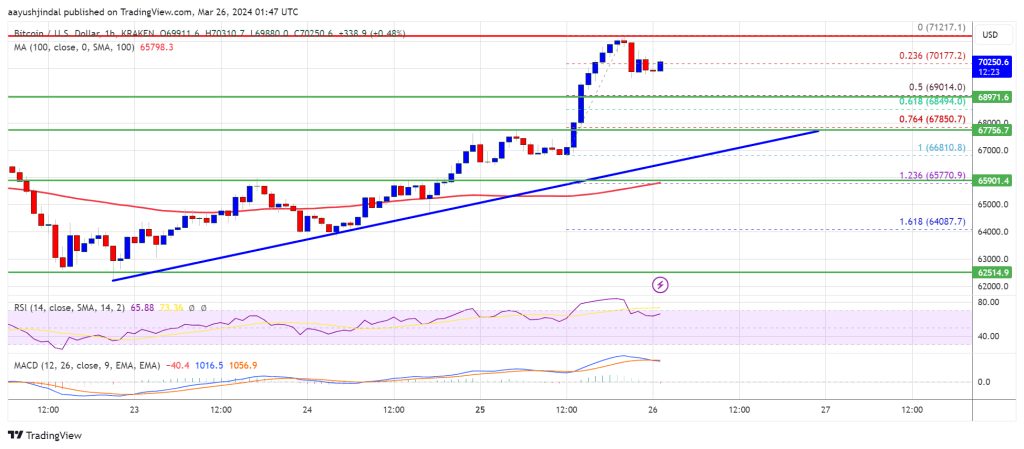
Bitcoin price remained stable above the $65,000 resistance zone. BTC climbed higher above the $67,500 and $68,000 resistance levels. The bulls even pumped the price above the $68,800 and $70,000 resistance levels.
A new weekly high was formed near $71,217 and the price is now consolidating gains. It is trading near the 23.6% Fib retracement level of the upward move from the $66,810 swing low to the $71,217 high. Bitcoin is also trading above $70,000 and the 100 hourly Simple moving average.
There is also a connecting bullish trend line forming with support at $67,500 on the hourly chart of the BTC/USD pair. The trend line is close to the 76.4% Fib retracement level of the upward move from the $66,810 swing low to the $71,217 high.
Source: BTCUSD on TradingView.com
Immediate resistance is near the $70,500 level. The first major resistance could be $71,200. If there is a clear move above the $71,200 resistance zone, the price could continue to gain strength. In the stated case, the price could even clear the $73,500 resistance zone in the near term. The next key resistance sits at $75,000.
Another Drop In BTC?
If Bitcoin fails to rise above the $71,200 resistance zone, it could start another decline. Immediate support on the downside is near the $70,000 level.
The first major support is $69,000. The next support sits at $67,800 and the trend line. If there is a close below $67,800, the price could start a drop toward the $66,800 level. Any more losses might send the price toward the $65,500 support zone in the near term.
Technical indicators:
Hourly MACD – The MACD is now losing pace in the bullish zone.
Hourly RSI (Relative Strength Index) – The RSI for BTC/USD is now above the 60 level.
Major Support Levels – $69,000, followed by $67,800.
Major Resistance Levels – $70,500, $71,200, and $73,500.
Disclaimer: The article is provided for educational purposes only. It does not represent the opinions of NewsBTC on whether to buy, sell or hold any investments and naturally investing carries risks. You are advised to conduct your own research before making any investment decisions. Use information provided on this website entirely at your own risk.
Ethereum Price Dips Alongside Bitcoin, Decoding Key Hurdles To Fresh Increase
Ethereum price struggled to rise above $2,550 and $2,580. ETH started a fresh decline like Bitcoin and traded below the $2,500 support zone.
- Ethereum attempted a fresh increase but failed to surpass $2,550.
- The price is trading below $2,500 and the 100-hourly Simple Moving Average.
- There is a connecting bearish trend line forming with resistance near $2,480 on the hourly chart of ETH/USD (data feed via Kraken).
- The pair continue to move down if there is a move below the $2,425 support.
Ethereum Price Extends Decline
Ethereum price struggled to gain pace for a move above the $2,550 and $2,580 resistance levels. ETH formed a short-term top and started a fresh decline below $2,500 like Bitcoin.
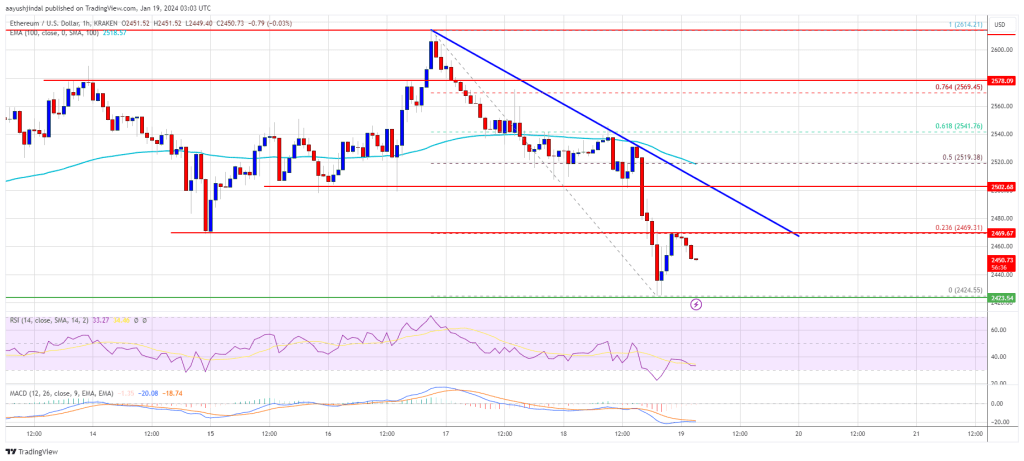
There was a move below the $2,450 level. A new weekly low was formed near $2,424 and the price is now consolidating losses. There was a minor increase above the $2,450 level, but the bears were active near the 23.6% Fib retracement level of the downward move from the $2,614 swing high to the $2,424 low.
Ethereum is now trading below $2,500 and the 100-hourly Simple Moving Average. On the upside, the price is facing resistance near the $2,465 level. The next hurdle could be $2,480. There is also a connecting bearish trend line forming with resistance near $2,480 on the hourly chart of ETH/USD.
The next major resistance is now near $2,520. A clear move above the $2,520 level might start a decent increase. In the stated case, the price could rise toward the $2,580 level.
Source: ETHUSD on TradingView.com
The next key hurdle sits near the $2,620 zone. A close above the $2,620 resistance could start another steady increase. The next key resistance is near $2,680. Any more gains might send the price toward the $2,720 zone.
More Losses in ETH?
If Ethereum fails to clear the $2,520 resistance, it could start another decline. Initial support on the downside is near the $2,440 level.
The next key support could be the $2,425 zone. A downside break below the $2,425 support might send the price further lower. In the stated case, Ether could test the $2,350 support. Any more losses might send the price toward the $2,320 level.
Technical Indicators
Hourly MACD – The MACD for ETH/USD is gaining momentum in the bearish zone.
Hourly RSI – The RSI for ETH/USD is now below the 50 level.
Major Support Level – $2,425
Major Resistance Level – $2,520
Disclaimer: The article is provided for educational purposes only. It does not represent the opinions of NewsBTC on whether to buy, sell or hold any investments and naturally investing carries risks. You are advised to conduct your own research before making any investment decisions. Use information provided on this website entirely at your own risk.
ADA Price Faces Key Hurdle, Can Cardano Surpass This To Start Fresh Rally?
Cardano (ADA) is attempting a recovery wave from the $0.4650 zone. ADA could start a fresh rally if there is a close above the $0.550 resistance.
- ADA price is moving higher from the $0.4650 zone.
- The price is trading below $0.570 and the 100 simple moving average (4 hours).
- There is a key bearish trend line forming with resistance near $0.545 on the 4-hour chart of the ADA/USD pair (data source from Kraken).
- The pair could accelerate higher if there is a clear move above $0.545 and $0.550.
Cardano Price Attempts Fresh Increase
After a strong rally, Cardano faced sellers near the $0.675 zone. ADA started a fresh decline below the $0.620 and $0.600 support levels, unlike Bitcoin and Ethereum.
There was a drop below the $0.550 support and the 100 simple moving average (4 hours). Finally, the price found support near the $0.4650 zone. The price is now attempting a fresh increase above the $0.500 resistance zone. The price tested the 23.3% Fib retracement level of the downward move from the $0.6768 swing high to the $0.4650 low.
ADA is now trading below $0.570 and the 100 simple moving average (4 hours). There is also a key bearish trend line forming with resistance near $0.545 on the 4-hour chart of the ADA/USD pair.
On the upside, immediate resistance is near the $0.532 zone. The first resistance is near $0.545 and $0.550. The next key resistance might be $0.570 or the 50% Fib retracement level of the downward move from the $0.6768 swing high to the $0.4650 low.

Source: ADAUSD on TradingView.com
If there is a close above the $0.570 resistance, the price could start a strong rally. In the stated case, the price could rise toward the $0.620 region. Any more gains might call for a move toward $0.650.
Another Decline in ADA?
If Cardano’s price fails to climb above the $0.545 resistance level, it could start a fresh decline. Immediate support on the downside is near the $0.500 level.
The next major support is near the $0.465 level. A downside break below the $0.465 level could open the doors for a test of $0.432. The next major support is near the $0.420 level.
Technical Indicators
4 hours MACD – The MACD for ADA/USD is losing momentum in the bearish zone.
4 hours RSI (Relative Strength Index) – The RSI for ADA/USD is now below the 50 level.
Major Support Levels – $0.500, $0.465, and $0.432.
Major Resistance Levels – $0.532, $0.545, and $0.570.
Disclaimer: The article is provided for educational purposes only. It does not represent the opinions of NewsBTC on whether to buy, sell or hold any investments and naturally investing carries risks. You are advised to conduct your own research before making any investment decisions. Use information provided on this website entirely at your own risk.
Bitcoin Price Faces Rejection – Why BTC Could Revisit $40K Before Fresh Increase
Bitcoin price extended its decline below the $42,650 zone. BTC is showing a few bearish signs and might extend its decline toward the $40,000 support.
- Bitcoin seems to be following a bearish path below the $43,500 level.
- The price is trading below $43,000 and the 100 hourly Simple moving average.
- There is a key bearish trend line forming with resistance near $43,200 on the hourly chart of the BTC/USD pair (data feed from Kraken).
- The pair could continue to move down toward the $40,500 and $40,000 support levels.
Bitcoin Price Dips Further
Bitcoin price struggled to start a fresh increase above the $43,500 and $43,650 resistance levels. BTC formed a short-term top and started a fresh decline below the $43,000 level.
There was a clear move below the $42,500 and $42,300 levels. The price even spiked below the $42,000 level. A low was formed near $41,637 and the price is now attempting a fresh increase. There was a move above the $42,000 level.
Bitcoin price climbed above the 23.6% Fib retracement level of the downward move from the $44,430 swing high to the $41,637 low. It is now trading below $43,000 and the 100 hourly Simple moving average. There is also a key bearish trend line forming with resistance near $43,200 on the hourly chart of the BTC/USD pair.
On the upside, immediate resistance is near the $43,000 level. It is close to the 50% Fib retracement level of the downward move from the $44,430 swing high to the $41,637 low. The first major resistance is forming near the trend line and $43,200.
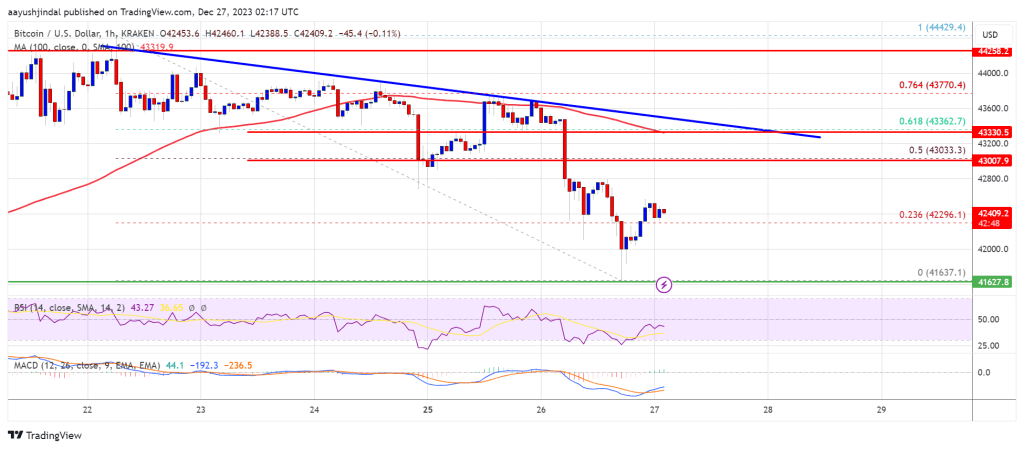
Source: BTCUSD on TradingView.com
A close above the $43,200 resistance could start a decent move toward the $44,000 level. The next key resistance could be near $44,300, above which BTC could rise toward the $45,000 level. Any more gains might send the price toward $46,500.
More Losses In BTC?
If Bitcoin fails to rise above the $43,000 resistance zone, it could start a fresh decline. Immediate support on the downside is near the $42,000 level.
The next major support is near $41,620. If there is a move below $41,620, there is a risk of more losses. In the stated case, the price could drop toward the $40,000 support in the near term.
Technical indicators:
Hourly MACD – The MACD is now losing pace in the bearish zone.
Hourly RSI (Relative Strength Index) – The RSI for BTC/USD is now below the 50 level.
Major Support Levels – $42,000, followed by $41,620.
Major Resistance Levels – $43,000, $43,200, and $44,300.
Disclaimer: The article is provided for educational purposes only. It does not represent the opinions of NewsBTC on whether to buy, sell or hold any investments and naturally investing carries risks. You are advised to conduct your own research before making any investment decisions. Use information provided on this website entirely at your own risk.
The pseudonymous crypto analyst Rekt Capital’s observations point to a promising future for the artificial intelligence (AI) cryptocurrency project, with a focus on Fetch.ai (FET).
Along with with a sizable 377,500 followers on the social media network X, the analyst offers a bullish prediction, stating that Fetch.ai is about to reach a new all-time high (ATH).
Rekt Capital’s investigation shows that the machine learning platform is presently experiencing a notable upswing following a successful retesting of a critical price level.
Technical Analysis Illuminates Fetch.ai Momentum
The spotlight placed on Fetch.ai’s retest points to a technical analysis viewpoint in which the price behavior of the project at this crucial level acts as a key predictor of potential future profits.
FET has increased over 300% since the cryptocurrency watchlist, claims Rekt. In terms of fluctuation in price, the AI cryptocurrency went up from $0.53 on December 9 to $0.67 on December 16.
Up almost +300% since the Altcoin Watchlist
Now trying to breach one of the final resistances before new All Time Highs
Weekly Close above the red resistance would be bullish#FET #Fetchai #Crypto pic.twitter.com/KUlU5ovkzH
— Rekt Capital (@rektcapital) December 15, 2023
Additionally, the technical analysis presents a positive picture for the cryptocurrency Fetch.ai, which has seen 60% of “green” trading days. Additionally, Fetch.ai is showing bullish indications from almost 30 technical indicators.
The rise in cryptocurrencies with an AI focus indicates a rising awareness of the possibilities at the nexus of blockchain technology and artificial intelligence.
An illustrative case in point is the significant increase in the value of Fetch.ai (FET) that followed its partnership with SingularityNET (AGIX).
FETUSD currently trading at $0.77175 on the daily chart: TradingView.com
The collaboration between Fetch.ai and SingularityNET most likely represents a strategic relationship with the goal of maximizing the technological synergies between the two enterprises.
SingularityNET is a platform that facilitates the production and trading of AI services. Fetch.ai could gain from SingularityNET’s experience and skills.
Earlier this week we announced we’ve strategically partnered with @SingularityNET to tackle some of #AI‘s biggest challenges! 🤖
This partnership focuses on overcoming #LLM hallucinations and enhancing multi-step reasoning 💡
— Fetch.ai (@Fetch_ai) December 17, 2023
Crypto And AI Synergy: Catalyst For Innovation
This partnership is proof of the expanding fusion of blockchain and artificial intelligence (AI), which many investors think has the potential to usher in a new wave of innovation in the cryptocurrency space.
At the time of writing, FET was trading $0.76, up 7.5% in the last 24 hours, and sustaining a weekly gain of 10% in the last week, data from Coingecko shows.
FET performed a picture-perfect retest of the purple level as support this week
Trying again to break beyond the red resistance
Very close to challenging for new All Time Highs
Just needs to break this red resistance and flip it to support#FET #Fetchai #Crypto pic.twitter.com/UptI8o74B1
— Rekt Capital (@rektcapital) December 19, 2023
There is a chance that FET would reach new all-time highs, which would be a challenge. According to Rekt, the crucial next step in realizing this potential is to successfully break through the red resistance and turn it into a level of support, which would represent a turning point in the price trend of FET.
All of this information was considered by industry experts when developing their Fetch.ai price forecasts. They anticipate that Fetch.ai’s value will reach $0.77 by the end of 2023, making it an intriguing DeFi coin to monitor.
Featured image from Shutterstock
Disclaimer: The article is provided for educational purposes only. It does not represent the opinions of NewsBTC on whether to buy, sell or hold any investments and naturally investing carries risks. You are advised to conduct your own research before making any investment decisions. Use information provided on this website entirely at your own risk.
Fresh outrage erupts over Warren anti-crypto bill as 5 more senators sign on

Senator Elizabeth Warren (D-MA) announced an expanded coalition of Senate support this week for a bipartisan bill to mitigate illicit finance risks posed by cryptocurrencies.
Five additional senators have signed on as the bill’s cosponsors, including three members of the Senate Banking, Housing and Urban Affairs Committee — Senators Raphael Warnock (D-GA), Laphonza Butler (D-CA), and Chris Van Hollen of Maryland (D-MD). Senators John Hickenlooper (D-CO) and Ben Ray Luján (D-NM) also joined.
The Digital Asset Anti-Money Laundering Act seeks to bring the crypto ecosystem into greater compliance with anti-money laundering frameworks governing the traditional financial system.
According to the Treasury Department, digital assets have increasingly been used for money laundering, ransomware attacks, theft schemes, terrorist financing, and other criminal activity. A White House report last year found that in 2021, illicit crypto transactions reached $20 billion globally – an all-time high.
The bill
The bipartisan Digital Asset Anti-Money Laundering Act aims to regulate digital assets like cryptocurrencies to combat illicit finance risks. It would expand the definition of “financial institutions” overseen for anti-money laundering compliance to include cryptocurrency miners, hardware wallet providers, and independent blockchain validators that facilitate digital asset transactions.
Within 180 days, the Treasury Department must issue anti-money laundering regulations for these newly covered entities. The bill grants the Treasury the authority to require their registration with FinCEN. It also sets a one-year deadline for FinCEN to finalize pending regulations on transactions involving convertible virtual currencies.
Additionally, the legislation directs FinCEN to impose new reporting rules and transaction oversight measures related to digital currency mixers and anonymity-enhanced cryptocurrencies often used to obscure asset provenance. It tasks the Treasury with crafting regulations forcing financial institutions to establish risk controls surrounding interactions with anonymizing digital asset technologies.
The bill also outlines requirements for FinCEN, the Securities and Exchange Commission, and the Commodity Futures Trading Commission to develop specialized examination procedures assessing compliance with anti-money laundering rules among digital asset sector participants.
The problem
If passed as written, the Digital Asset Anti-Money Laundering Act could substantially impact Bitcoin. Designating Bitcoin miners, validators, and other network supporters as “financial institutions” would mandate their compliance with anti-money laundering rules and monitoring of the Bank Secrecy Act. This places new regulatory burdens and oversight on key players upholding the Bitcoin system. By directly targeting “anonymity enhanced cryptocurrencies” and leveraging mixing services to mask transactions, the bill also threatens Bitcoin’s privacy appeal through prohibitions on interacting with tools that preserve user anonymity.
Additionally, expanded powers for the Financial Crimes Enforcement Network over cryptocurrency exchanges may increase scrutiny and regulation of entry/exit points between Bitcoin and fiat money. New reporting requirements could make Bitcoin transactions more arduous. Some argue sweeping digital asset supporters like node operators and wallet providers into the expansive definition of financial institutions may discourage participation in Bitcoin infrastructure. Diminished decentralization could then undermine network resilience.
In essence, while the bill seeks to limit illicit uses of cryptocurrencies through strict anti-money laundering policies, imposed compliance challenges combined with reduced privacy and decentralization may simultaneously obstruct benign Bitcoin advancement and adoption.
The bipartisan bill reflects growing pressure to regulate cryptocurrencies amid widening adoption. Additional oversight aims to curb illicit uses while promoting accountability across the industry. Yet imposed regulations also risk hampering technological progress, spurring intense debate among lawmakers and tech leaders.


