 As of April 15, 2024, bitcoin presents a mixed landscape of consolidation and subtle recovery hints, reflecting a crucial moment for potential bullish or bearish trends. Bitcoin Despite the current market indecisiveness indicated by the 1-hour chart, the 4-hour and daily charts suggest underlying movements that could influence future price actions. The 1-hour chart displays […]
Source link
Indicators
XRP price is holding gains above the $0.60 zone. The price could gain bearish momentum if there is a close below the $0.570 support zone.
- XRP is facing a major hurdle near the $0.6580 zone.
- The price is now trading below $0.640 and the 100 simple moving average (4 hours).
- There is a key bearish trend line forming with resistance near $0.640 on the 4-hour chart of the XRP/USD pair (data source from Kraken).
- The pair could gain bearish momentum if there is a close below the $0.5720 support.
XRP Price Faces Uphill Task
After a steady decline, XRP price found support near the $0.5720 level. A low was formed at $0.5714 and the price started a fresh increase, like Bitcoin and Ethereum.
There was a move above the $0.5880 and $0.600 resistance levels. The price cleared the 23.6% Fib retracement level of the downward wave from the $0.7442 swing high to the $0.5714 low. The bulls pushed the price above the $0.620 resistance zone, but the bears are active near $0.640.
Ripple’s token price is now trading above $0.6320 and the 100 simple moving average (4 hours). On the upside, immediate resistance is near the $0.640 zone. There is also a key bearish trend line forming with resistance near $0.640 on the 4-hour chart of the XRP/USD pair.
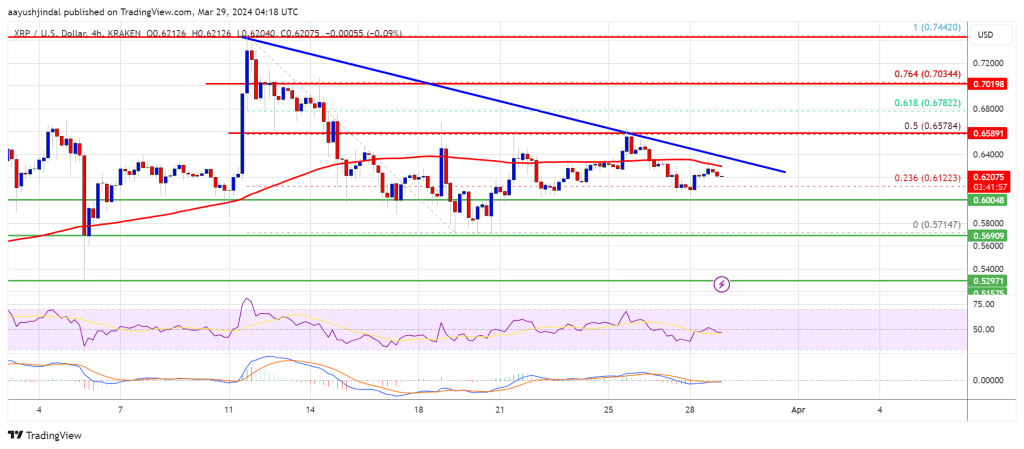
The next key resistance is near $0.6580. It is close to the 50% Fib retracement level of the downward wave from the $0.7442 swing high to the $0.5714 low. A close above the $0.6580 resistance zone could spark a strong increase. The next key resistance is near $0.700. If the bulls remain in action above the $0.700 resistance level, there could be a rally toward the $0.7440 resistance. Any more gains might send the price toward the $0.800 resistance.
More Losses?
If XRP fails to clear the $0.640 resistance zone, it could start another decline. Initial support on the downside is near the $0.600 zone.
The next major support is at $0.5720. If there is a downside break and a close below the $0.5720 level, the price might accelerate lower. In the stated case, the price could retest the $0.5250 support zone.
Technical Indicators
4-Hours MACD – The MACD for XRP/USD is now losing pace in the bullish zone.
4-Hours RSI (Relative Strength Index) – The RSI for XRP/USD is now above the 50 level.
Major Support Levels – $0.600, $0.5720, and $0.5250.
Major Resistance Levels – $0.640, $0.6580, and $0.700.
Disclaimer: The article is provided for educational purposes only. It does not represent the opinions of NewsBTC on whether to buy, sell or hold any investments and naturally investing carries risks. You are advised to conduct your own research before making any investment decisions. Use information provided on this website entirely at your own risk.
The price of Bitcoin witnessed a pullback on Tuesday amid a general bearish sentiment around the crypto market, after the digital asset reached the $69,000 threshold.
Bitcoin Might Undergo Further Correction
Following the correction, several predictions of a further decline in the price of Bitcoin from top crypto analysts have surfassed. Cryptocurrency analyst and trader Ali Martinez has highlighted a few indicators that suggest a continuous retracement in price.
Martinez took to the social media platform X (formerly Twitter) to share his projections with the crypto community. According to Ali Martinez, on the daily chart of Bitcoin, the Tom DeMark (TD) Sequential indicator presently “flashed a sell signal.”
The crypto analyst believes that this development deserves to be closely monitored. This is because the indicator “boasts a solid history of predicting Bitcoin trends” since the beginning of the year.
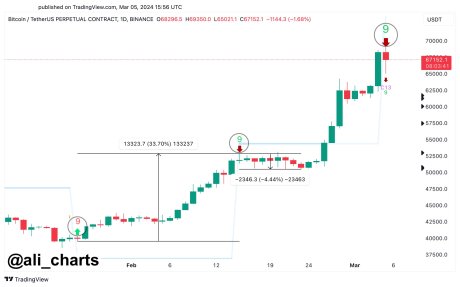
He further pointed out that the indicator suggested a buy signal earlier in January, which was followed by a 34% rise in Bitcoin’s price. In addition, in the middle of last month, the indicator also suggested a sell signal, after which Bitcoin plummeted by over 4%.
With the TD Sequential presently developing a sell signal, BTC might be poised to undergo a correction in the short term. However, there is no guarantee that the price of BTC will see a correction following the signal.
Martinez also underscored the accuracy of the pointer in predicting BTC’s price movement, which he believes to be “remarkably insane.” In a previous projection, Martinez asserted that BTC has declined by “1.5% to 4.7%, each time the indicator recommends a selling” since February 15.
As a result, short-term traders should carefully observe the trend in order to position themselves for future gains. So far, some market watchers feel that Bitcoin’s retracement was necessary, and they perceive the fall as a positive move.
BTC Could See A 20% Drop This Time Around
Martinez is not the only expert that has predicted a pullback in the short term. Crypto Jelle has also shared his negative forecast for BTC, pointing to a 20% price correction.
Jelle noted as BTC moves towards its all-time high of $69,000, “there will be downturns along the way.” He further stated that this “time around,” it seems BTC might decline by 20%.
Thus, the crypto analyst has urged not to be shaken by the outcome while telling them to “take advantage” of the development when it occurs. This is because Jelle believes that the key to making it in the crypto space is patience.
Currently, the price of Bitcoin is down by over 2% in the last 24 hours, trading slightly above $66,000. Despite the price drop, its trading volume is up by over 37%, while its market cap is down by 2%.
Featured image from iStock, chart from Tradingview.com
Disclaimer: The article is provided for educational purposes only. It does not represent the opinions of NewsBTC on whether to buy, sell or hold any investments and naturally investing carries risks. You are advised to conduct your own research before making any investment decisions. Use information provided on this website entirely at your own risk.
Ethereum Price Key Indicators Suggest A Strengthening Case For Surge To $3,800
Ethereum price is consolidating gains above $3,400. ETH is showing positive signs and might soon aim for a move above the $3,500 resistance zone.
- Ethereum is holding gains and consolidating below the $3,500 resistance zone.
- The price is trading above $3,400 and the 100-hourly Simple Moving Average.
- There is a key bullish trend line forming with support at $3,420 on the hourly chart of ETH/USD (data feed via Kraken).
- The pair seems to be setting up for a move toward the $3,650 and $3,800 levels.
Ethereum Price Remains Supported
Ethereum price formed a base above the $3,350 level and started another increase, like Bitcoin. ETH broke the $3,400 level to set the pace for more upsides.
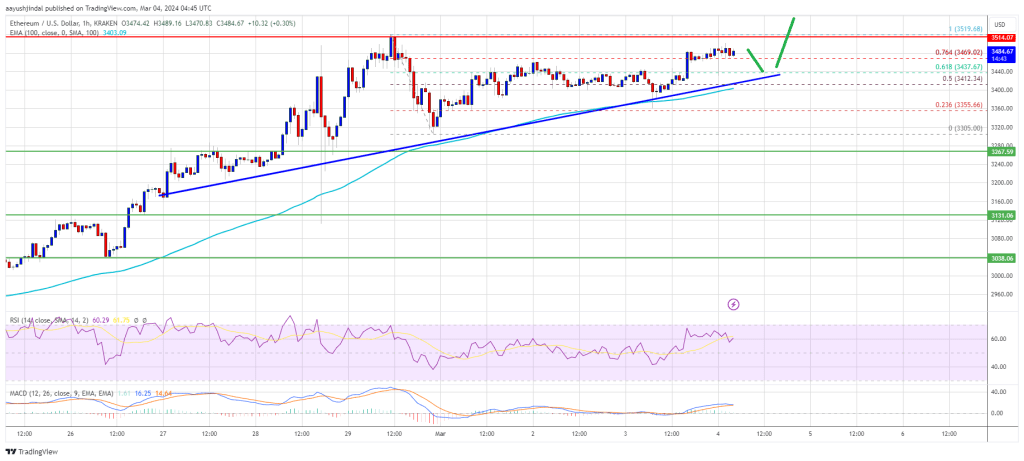
There was a clear move above the 50% Fib retracement level of the downside correction from the $3,519 swing high to the $3,305 low. The bulls are now active above the $3,420 level. There is also a key bullish trend line forming with support at $3,420 on the hourly chart of ETH/USD.
Ethereum is now trading above $3,450 and the 100-hourly Simple Moving Average. It is showing positive signs above the 76.4% Fib retracement level of the downside correction from the $3,519 swing high to the $3,305 low.
Immediate resistance on the upside is near the $3,500 level. The first major resistance is near the $3,520 level. The next major resistance is near $3,550, above which the price might gain bullish momentum. The next stop for the bulls could be near the $3,650 level.
Source: ETHUSD on TradingView.com
If there is a move above the $3,650 resistance, Ether could even rally toward the $3,720 resistance. Any more gains might call for a test of $3,800.
Are Dips Supported In ETH?
If Ethereum fails to clear the $3,520 resistance, it could start a downside correction. Initial support on the downside is near the $3,420 level and the trend line.
The first major support is near the $3,400 zone or the 100 hourly SMA. The next key support could be the $3,350 zone. A clear move below the $3,350 support might send the price toward $3,320. Any more losses might send the price toward the $3,150 level.
Technical Indicators
Hourly MACD – The MACD for ETH/USD is gaining momentum in the bullish zone.
Hourly RSI – The RSI for ETH/USD is now above the 50 level.
Major Support Level – $3,400
Major Resistance Level – $3,520
Disclaimer: The article is provided for educational purposes only. It does not represent the opinions of NewsBTC on whether to buy, sell or hold any investments and naturally investing carries risks. You are advised to conduct your own research before making any investment decisions. Use information provided on this website entirely at your own risk.
Cardano Poised For Massive Rally As Key Indicators Signal Bullish Reversal, ADA Surges 14%
ADA, the native token of the Cardano ecosystem, has experienced a notable surge in price, taking advantage of Bitcoin’s (BTC) stagnation above the $52,000 level. With gains of 20% and 14% over the past thirty and fourteen days, respectively, ADA has reignited bullish sentiment among investors.
The token’s recent performance has not gone unnoticed, as crypto analyst “Trend Rider” makes a bold price prediction, highlighting key indicators that suggest a potential long-term bull run for ADA.
ADA’s Potential Bull Run Ahead
In a social media post on X (formerly Twitter), Trend Rider emphasized that ADA is striving to consolidate above the crucial $0.600 mark, which holds significant prospects for the token’s future.
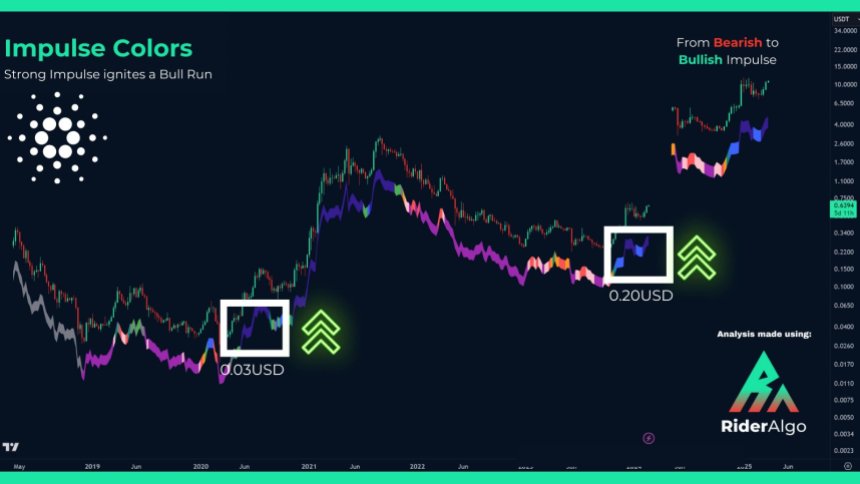
The analyst drew attention to an indicator called Impulse colors, which tracks the price distance from key moving averages. During the bear market, opposing trends were predominantly indicated by fuchsia and pink hues as seen in the chart below.
However, recent weeks have witnessed a return to dark blue, the most bullish color on this scale. Notably, this shift in momentum last occurred in 2020 when ADA’s price surged from $0.03 to $1.4 before the re-emergence of pink hues.
Furthermore, Trend Rider highlighted another positive development— the Wave Oscillator has re-entered the positive zone after 20 months. According to the analyst, this shift indicates growing bullish momentum for ADA.
The pivotal level identified in this context is the $0.60 mark. To solidify this shift, ADA’s price must hold and close above $0.60, which may catalyze a bullish long-term breakout.
It is worth noting that this analysis is based on the 1-month timeframe, which significantly influences long-term market movements.
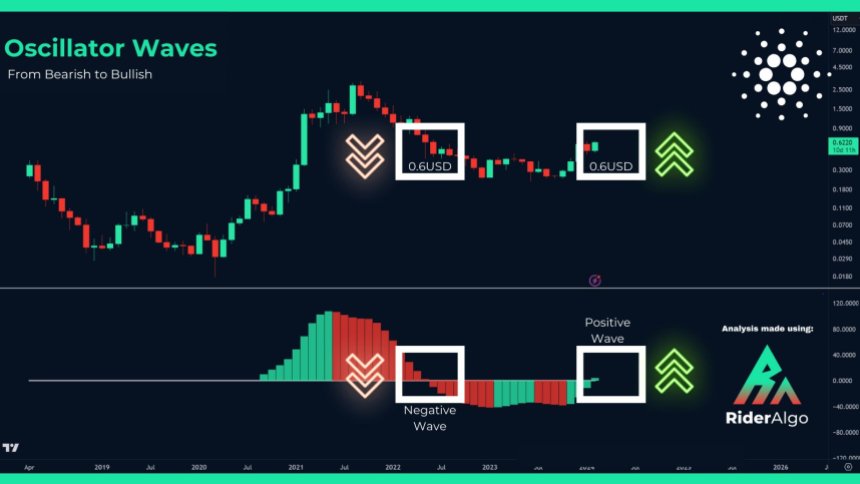
These indicators suggest that ADA may be poised for a sustained uptrend, potentially paving the way for a long-term bull run.
Cardano Sustained Bullish Trend
According to the one-day ADA/USD chart below, Cardano’s token reached a 21-month high of $0.679 on December 28, which marked the beginning of a period of volatility in ADA’s price. Following a price correction, ADA dropped to $0.449 on January 23.
However, in line with the overall market trend, ADA has regained bullish momentum. Nonetheless, this upward movement may face resistance from bears as it encounters various obstacles.
If the current uptrend continues in the coming weeks, ADA must overcome significant resistance levels that have hindered its growth above the $0.679 mark.
Successful consolidation above the critical $0.600 level will be crucial. ADA will face the $0.637 obstacle soon before potentially surging above $0.670, the last hurdle before reaching $0.700. Reaching this milestone would position Cardano’s native token favorably to target the $1 mark, benefiting from the overall market growth expected in the coming months of 2024.
Adding to the bullish prospects for Cardano, ADA has been establishing higher lows and higher highs during its price surge, indicating a healthy price action and a sustained bullish trend. However, it remains to be seen whether this trend can be sustained or if bears will dictate ADA’s future price direction.
Featured image from Shutterstock, chart from TradingView.com
Disclaimer: The article is provided for educational purposes only. It does not represent the opinions of NewsBTC on whether to buy, sell or hold any investments and naturally investing carries risks. You are advised to conduct your own research before making any investment decisions. Use information provided on this website entirely at your own risk.
The PEPE meme coin has seemingly faded into the shadow as new and exciting meme coins make it to the fore. This can be attributed to the likes of BONK and other Solana ecosystem meme coins that have taken the attention away from the Ethereum ecosystem. However, as excitement around these new meme coins begins to wane, expectations fall back to the leaders of the market, one of which is PEPE, who could be getting ready to make a comeback.
What On-Chain Indicators Say About PEPE
On-chain indicators are one way to know if investor interest is turning toward a particular cryptocurrency, in this case, PEPE. These indicators include things like Weighted Sentiment, Transactions Volumes, New Holders, etc. In this case, the focus is on the Weighted Sentiment, which measures sentiment across social media platforms to figure out how crypto investors are viewing a coin.
This indicator can be useful, especially in times like these when there are no clear indicators of where the price of a coin could be headed next. So, by checking what investors are saying about PEPE on social media platforms such as X (formerly Twitter), one can get a good idea of where the price may be headed next.
According to the Weighted Sentiment by the on-chain analytics tracker Santiment, PEPE is looking quite bullish. The indicator takes into account the mentions of PEPE on social media platforms over the past week, and it shows that there has been a significant uptick in the positive sentiment that is associated with the meme coin.
Source: Santiment
While it is not the highest that the indicator has been since the year began, it is still sitting at a considerably high level, suggesting a turn in the average sentiment. This also coincides with a drastic rise in the holdings of the largest PEPE whales, showing a willingness to accumulate at the current levels.
Daily Trading Volume Sees A Significant Jump
The Weighted Sentiment is not the only PEPE metric that has seen a significant increase lately. In the same vein, the daily trading volume for the meme coin has been on the rise as well. As data from CoinMarketCap shows, the meme coin’s volume is up approximately 62% in the last day, bringing it to $89.8 million at the time of writing.
Such a rise in volume can either point to buying or selling, but seeing that the PEPE price has managed to hold steady over this time period, it suggests that there is more buying than selling. Given this, it could point to bulls finally establishing support and marking $0.0000009 as a buy level. If this general bullish sentiment continues, then the meme coin could be looking toward a recovery to $0.000001, which would translate to a 10% move from here.
Due to its decline over the last month, PEPE has lost its position as the third-largest meme coin in the space. It is currently sitting at fifth position behind the likes of BONK and CorgiAI.
Token price falls to $0.000000896 | Source: PEPEUSDT on Tradingview.com
Featured image from ABP Live, chart from Tradingview.com
Disclaimer: The article is provided for educational purposes only. It does not represent the opinions of NewsBTC on whether to buy, sell or hold any investments and naturally investing carries risks. You are advised to conduct your own research before making any investment decisions. Use information provided on this website entirely at your own risk.
In an exciting turn of events, Dogecoin (DOGE), the popular meme-based cryptocurrency, is once again attracting attention in the market as February approaches. Meme coins, including DOGE, are gearing up for a potential comeback amidst a renewed sense of recovery in the crypto market.
The surge in network expansion, if sustained, has the potential to positively impact the price of DOGE, according to market experts. Over the past week, the number of new addresses in the Dogecoin network has skyrocketed by over 1,000%, showcasing the increasing interest and participation in the cryptocurrency.
This surge reached an all-time high on January 29, with an unprecedented 247,200 new DOGE addresses created in a single day.
According to the most recent data available, Dogecoin is presently being traded at $0.07, accompanied by a 24-hour trading volume amounting to around $1 billion and a market capitalization of $11.50 billion.

Source: Coingecko
Dogecoin Upward Trajectory Signals Positive Trend
Although Dogecoin witnessed a marginal 1.7% decrease in value within the last 24 hours, it has gained 1.4% increase over the course of the past week. This upward trajectory suggests a positive trend that is likely to be well-received by both investors and enthusiasts in the cryptocurrency community.
The projected minimum and maximum prices are expected to hover around $0.0816 and $0.0838, respectively. These figures provide investors with a glimpse into the potential price range for DOGE in the coming months.
Dogecoin currently trading at $0.07979 on the daily chart: TradingView.com
A recent post by crypto analyst Ali Martinez on X has shed light on a remarkable surge in growth within the Dogecoin network, indicating signs of a swift reversal in its price trend.
The #Dogecoin network is witnessing a remarkable surge in growth, with new addresses increasing by a staggering 1,100% over the past week!
On January 29 alone, a record-breaking 247,240 new #DOGE addresses were created, marking an all-time high. A sustained uptrend in network… pic.twitter.com/7tNAPzJaP2
— Ali (@ali_charts) January 30, 2024

Source: @ali_charts/IntoTheBlock
And in a related development, prominent cryptocurrency exchange Changelly has released its most recent Dogecoin price forecast, predicting a marginal 0.05% increase that could propel the value to $0.08 by January 31, 2024.
Doge’s Momentum: Bullish Signals Amid Skepticism
However, it is important to note that the prevailing market sentiment, as indicated by Changelly’s analysis of technical indicators, leans towards bearish, with a Bearish Bearish score of 55%. The Fear & Greed Index stands at 55, indicating a slight inclination towards greed among market participants.
With the surge in new addresses and the positive outlook from analysts, the cryptocurrency community is eagerly monitoring Dogecoin’s movements.
Enthusiasts and investors alike are eagerly awaiting to see whether the meme coin will “pop” and break through in the coming weeks. The recent surge in network growth and the optimistic market sentiment surrounding Dogecoin indicate that it may continue to be a focal point of interest in the cryptocurrency market.
In the meantime, the question lingers: Can February be Doge’s month? With bullish indicators suggesting a potential price explosion, excitement is palpable. As Dogecoin gains momentum with its growing network and positive sentiment, the coming weeks will be pivotal.
Featured image from Shutterstock, chart from TradingView
Disclaimer: The article is provided for educational purposes only. It does not represent the opinions of NewsBTC on whether to buy, sell or hold any investments and naturally investing carries risks. You are advised to conduct your own research before making any investment decisions. Use information provided on this website entirely at your own risk.
Leading indicators fall again, but U.S. appears no closer to recession

Breaking news. Check back for updates.
The numbers: The leading indicators for the U.S. economy fell again in December to mark the 21st decline in a row, but a widely predicted recession still appears no closer than when the long losing streak first began.
The leading index slid 0.1% last month, but it was smaller than the 0.3% drop forecast by economists polled by the Wall Street Journal.
The losing streak is the third longest on record
The two other times the index was negative for so long, a recession took place. Yet the economy has not followed the usual patterns since the 2020 pandemic.
Key details: Six of the 10 indicators in the survey were positive in December, a big improvement compared to prior months.
The leading index is a gauge designed to show whether the economy is getting better or worse. The report is published by the nonprofit Conference Board.
Big picture: The economy has continued to expand through a period of high inflation and rising interest rates orchestrated by the Federal Reserve to get prices back under control.
The U.S. grew at a rapid 4.9% annual pace in the third quarter and gross domestic product is estimated to have expanded by almost 2% in the recently ended fourth quarter.
Economists are split on whether a recession is likely, but if the Federal Reserve cuts interest rates this year it could help the U.S. to avert a downturn. Central bank officials have signaled they are probably done raising rates.
Looking ahead: The Conference Board is sticking to its forecast.
“Overall, we expect GDP growth to turn negative in [the second and third quarters] of 2024 but begin to recover late in the year,” said Justyna Zabinska-La Monica, senior manager of business cycle indicators.
Market reaction: The Dow Jones Industrial Average
DJIA
and S&P 500
SPX
rose in Monday trading.
A Crypto Christmas Special With Material Indicators: Past, Present, And Future
Nobody could argue that 2022 was anything but a bear market. After Bitcoin reached an ATH in November of 2021 we saw the bear market develop in classic fashion by losing support at key technical levels. While the bear was playing out in somewhat predictable fashion, the market was caught off guard by the events that led to the FTX crash in November 2022. Because the contagion from FTX had a devastating ripple effect that was felt by the largest institutions with crypto exposure as well as banks, I actually expected prices to fall even lower.
At the time, fear and fighting among institutional players like Galaxy, Gemini and Grayscale (under DCG) who were among SBF’s largest institutional victims added to the concern that price would grind down towards the lower teens, yet somewhat remarkably and perhaps not so coincidentally on January 1, 2023 Bitcoin started to rally. What was first considered weekend whale games evolved long past the weekend, and in fact, through Q1/2023 I identified an entity on FireCharts which I nicknamed “Notorious B.I.D.” that was double stacking large blocks of bid liquidity to push price higher. There was a pattern to the behavior that made it somewhat predictable and tradable. Those moves were well documented in my X feed during that period of time. Once price reached $25k that entity disappeared. Even without the help of that manipulation pushing price up, and despite the fact that the macroeconomic situation was horrible, the geopolitical situation went from bad to worse and the US political situation evolved from a dysfunctional sh*t show to a full blown circus, the market continued to rally.
Now, nearly 12 months and > 150% from the day the rally began, the debate between bulls and bears over whether this is a confirmed bull market or a sequence of bear market distribution rallies literally continues today. While it’s understandable that someone could look at 150% and immediately assume bull market, it does require a deeper understanding of what distribution and accumulation look like. From my view, that still isn’t as clear as one would expect. Historically, the Purple Class of Whales with orders in the $100k – $1M range have had the most influence over BTC price direction. The order flow data I’ve been monitoring on Binance shows that through most of the year they (along with larger MegaWhales) have been buying dips and distributing significantly more than they bought on those dips on the uptrends that followed.
Only recently have we seen an uptick that could be an indication that the trend is shifting. Parallel to that, some on-chain data providers are showing an increase in the number of wallets holding BTC which is also an indication that we could be transitioning from a distribution phase to an accumulation phase and I’m looking for more clear evidence of that. One of the things I look for to get a sense of that is bid liquidity. I believe that “Liquidity = Sentiment,” and it’s no secret that order books have been thin on both sides of price through most of the year, however in the last 3 weeks or so, we’ve started seeing more institutional sized bid ladders coming into the order book and that fact supports a bullish thesis, as long as they don’t dump through the next pump.
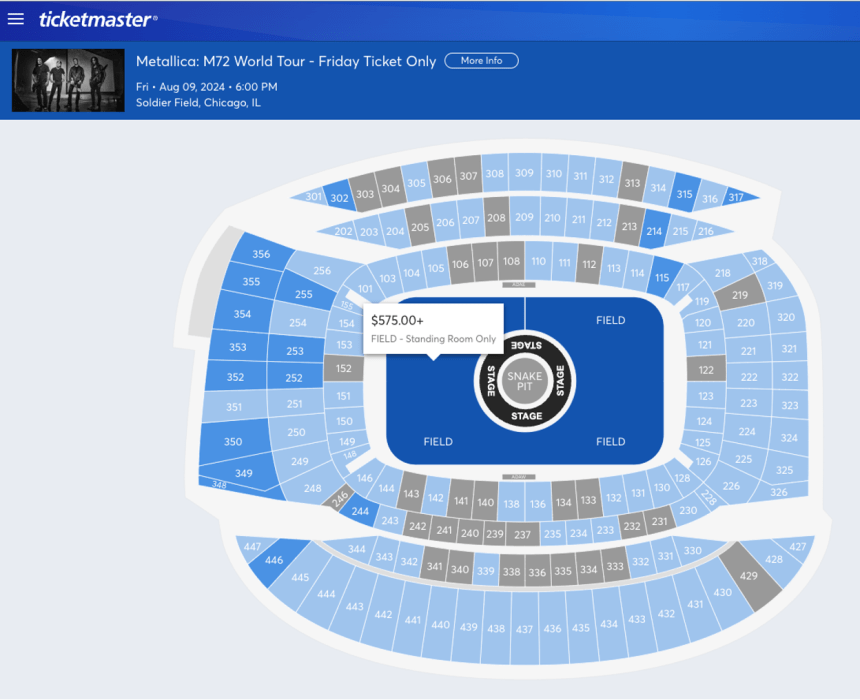
With all of the above in mind, there are most certainly turns and twists that investors should look out for. Sure we are starting to see some improvements on the U.S. inflation and unemployment numbers, but something in those reports doesn’t jive with reality. For most middle and lower income Americans, credit card debt is climbing to new highs, rents have soared, home ownership is unattainable, grocery prices are high and a Metallica “Standing Room Only” Field ticket is $575. So in my mind, we still have a percolating macroeconomic problem and the geopolitical and U.S. political issues seem to get worse by the day.
Aside from that, the RSI has been over cooked for an extended period of time and we just had 8 consecutive green weekly candles. Both of those factors have historically led to corrections. I could give you the “History doesn’t have to repeat itself…” spiel or I can show you what historically happens after moves like this and let you decide.
Another potential twist to consider is that the current PA has a striking resemblance to the first leg of the 2019 rally that turned out to be a Fib retracement, that ultimately got rejected from the top of the Golden Pocket at .618 Fib. That led to a 53% correction before the Covid Crash took it down more than 70% from the .618 Fib.
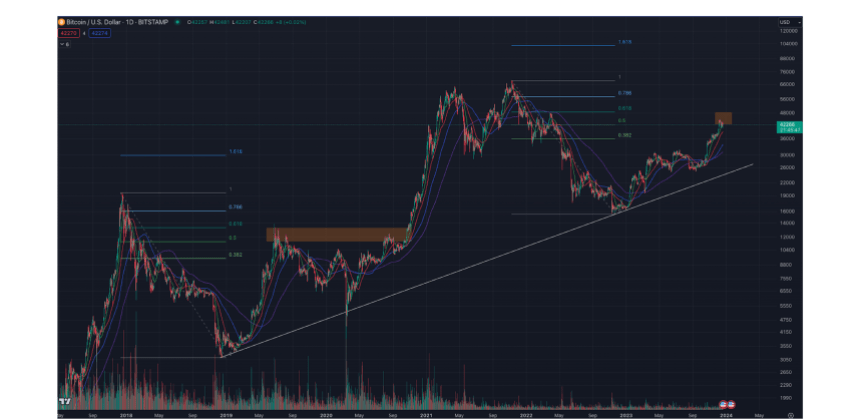
At this stage, I’d be surprised to see a downside move that deep without the aid of a Black Swan, but we are currently having some interaction with the Golden Pocket that seems familiar. While it is reasonable to expect some resistance entering and exiting the Golden Pocket, there is one very weird twist to what we are seeing and that is a strange pattern I’ve noticed occurring on or around December 17th. Every year since 2017 there has been a move on December 17th that had Macro implications. The only exception to that is last year when it happened on December 20th. On each occasion the price action led to a macro breakout or breakdown. It’s too soon to tell if this move will validate the pattern on the day of writing (Dec 19th), but on the 17th we saw BTC get rejected from the lower end of the Golden Pocket and also lose the 21-Day moving average. Price has been flirting with both of those levels ever since so we’ll have to wait to see how it plays out over time. Aside from those things I’m watching the upcoming ETF window very closely. I think that the market is numb to SEC delays on these decisions, but there is so much anticipation that this time we’ll see an approval, that a flat out rejection has the potential to be the catalyst that triggers a correction.
Regardless of where you side on whether we are or are not in a confirmed bull market, we’re seeing a lot of evidence that if we are not in it, we’re close to it. If you’re a long term investor and you haven’t already started building a position, it’s a good time to identify some targets to start scaling into one. This of course depends on your time horizon and risk appetite, but if you have a long term outlook and 6 figure targets for BTC it’s still early enough to get in, but it’s also a good idea to save some dry powder for a correction because in my opinion, it’s not a matter of if it will come, but when.
Q: Right now, we are seeing Bitcoin reach new highs. Do you think we are in the early days of a full bull run? What has changed in the market that enabled the current price action; is it the Bitcoin spot ETF or the US Fed hinting at a loser policy or the upcoming Halving? What is the big narrative that will go on in 2024?
Despite the ongoing debate between bulls and bears over whether or not we’ve been in a bull market, I can say that despite the uptrend, there has been no clear confirmation that we’ve been in a bull market through most of the year. However, the fact that we’ve recently started to see more institutional sized bid ladders coming into the order book along with the on-chain data that indicates more wallets holding for longer and the recent buying after the R/S flip at $40k are indications that we may be on the verge of a breakout.
There’s no doubt in my mind that a lot of the momentum we’ve been seeing is related to the next ETF decision window opening January 5-10 and the April 2024 Halving. The FED’s recent decision to pause rate hikes and hint at a pivot to cuts in 2024 certainly added fuel to that momentum that pushed price above $40k. In typical crypto form, we also had some help in late October through early December when I noticed some familiar patterns in the order book. I can’t confirm with absolute certainty if it was the Notorious B.I.D. spoofer we saw in Q1 returned, but it was the same game I identified through Q1 being executed and there is no question that it helped push price up through the $35k – $40k range before it disappeared.
(…) As much as I’d like to see a correction come before we get there (the Bitcoin spot ETF decision), the market doesn’t care what I want. I would expect it to come before the Halving. Whether it comes before or after the ETF decision window closes remains to be seen. In the meantime, I’ll continue to watch order book and order flow data and trade what’s in front of me.
Q: Last year, we spoke about the most resilient sectors during the Crypto Winter. Which sectors and coins will likely benefit from a new Bull Run? We are seeing the Solana ecosystem bloom along with the NFT market; what trends could benefit in the coming months?
A 24-year-old stock trader who made over $8 million in 2 years shares the 4 indicators he uses as his guides to buy and sell

-
One of Jack Kellogg’s main indicators is the volume-weighted average price (VWAP).
-
This shows the average price paid for shares and helps him gauge sentiment.
-
He only uses indicators as a rough guide but never trades solely on them, he noted.
Jack Kellogg began trading stocks right out of high school in 2017.
Five years into his craft, he has already been exposed to various types of market conditions, including the stock market crash of 2020, the raging bull rallies of 2021, and the bear market of 2022. One thing he has learned through it all is to keep things simple and remain flexible.
“There’s this acronym: KISS, keep it simple stupid. I don’t think people need super fancy indicators to make money trading. I’m just using basic trend lines, support, resistance, volume, and those are all my indicators,” Kellogg said. “I think if you overcomplicate the indicators, it will actually throw off your trading because then you’re trading more on the indicators than the actual price action.”
This attitude has allowed him to become a versatile trader who takes both long and short positions when appropriate, which helped him to continue trading throughout the bear market of 2022. His tax returns, viewed by Insider, showed that he reported over $8 million in gains from day trading in 2020 and 2021. His returns gained momentum in 2020 when he had a total income of $1.6 million. In 2021, that amount grew to a total income of $6.5 million.
Kellogg has come a long way since starting off with $7,500 which is what he initially deposited when he started trading. His road to success wasn’t a straight line. When he first attempted to trade, he was down a few hundred dollars. This led him to realize that he didn’t know what he was doing.
So his next moves included switching off real trading and testing his skills through paper trading. Then, he signed up for an online course his parents helped pay for. The program, which was created by Timothy Sykes, a trading teacher and former penny-stock trader known for claiming to flip his bar mitzvah cash gift into over $1 million in gains, helped him develop the skills and patience he then used to craft his skill.
By the time the stock market began to rally hard in 2020, he was ready to ride the upwards wave. In 2022, when the market slowed, he continued to reel in profits by betting on popular stocks like Bed Bath and Beyond (BBBY) and AMC (AMC), the latter of which banked him $60,000, according to a screenshot of his E-Trade brokerage account. He also traded a few small-cap stocks and saw large wins on single trades like Intelligent Living Application Group Inc. (ILAG) which earned him over $91,000, according to screenshots of his Guardian account.
His top 4 indicators
The first indicator he uses as a sentiment guide is the volume-weighted average price (VWAP), which shows the average price paid for shares through all trading adjusted for volume. He uses it on the daily chart as a guide to determine a good buy-in price for the stock he’s trading. This keeps him from being a chaser, the term popularly used for those who enter a position too late or after a stock begins to rally.
If the goal is to buy low and sell high, you don’t want to pay more than what the average buyer paid, he noted. Therefore, Kellogg won’t enter a position if the price is above the VWAP line. The opposite is true if he’s shorting a stock: if the price is beneath the VWAP, he generally won’t short the stock.
Oftentimes, he’ll use this indicator to also determine when to exit his position because that point can sometimes indicate where a stock’s price will begin to drop off. The same is also true in reverse: he’ll sometimes use the VWAP to determine the price point where he’ll cover his position. Therefore, if he shorted a stock at $9 and the VWAP is at $7.50, he’ll use that price as a point to lock in profits.
For example, on January 5, he took a short position on ticker AMTD at $2.50. VWAP’s center line was trending at around $2.22. So Kellogg covered his position at $2.25 and made a 10% profit.
The next indicator is linear regression, which shows the direction price is trending and when it may change its direction. They are three lines that overlay the candles. The lower and upper lines are the ranges of price movements or volatility, while the center line indicates the average between the two. Price action above the top line signals an overbought stock, and below the bottom line, an oversold stock.
“So the better a stock is respecting the lines of the channel that’s created, the more predictable I think the stock’s going to be,” Kellogg said. This gives him a better sense that the stock’s price action will trend according to his thesis.
The next indicator is volume which shows the number of shares being traded at any moment in time. Kellogg mainly uses volume as a potential indicator that a stock may reverse.
“Seeing big volume go through, I know that potentially a lot of people are on the wrong side. So if a big volume spike goes through near the high of the day, it’s possible that a lot of people are buying the stock and a lot of people are chasing,” Kellogg said.
Finally, he keeps his eye on the support and resistance lines, the former being where the price tends to hold and the latter where it tends to sell off. The levels change throughout the day. Kellogg tries to find the key levels by looking for a parallel increase in volume in those areas. He also pays attention to how many times and for how long a price level holds to determine how strong that point is. While it’s not an exact science, general areas where the price hoovers for 30 minutes to an hour are the strongest, he said.
“Eventually, you’ll see a bouncing ball-type price action if the stock is going to go lower,” Kellogg said. “So you see it bounce from $7 to $8, then bounce again from $7.30 to $7.50, and then bounce from $7.40 to $7.10, then bounce from $7.20 and eventually cracks the support below $7. And then the question is, is it going to create a resistance level at $7 and continue to head lower?”
At the end of the day, price action is king, Kellogg noted. Even if you have a thesis about why a stock’s price can move in a certain direction, if the price is moving differently, you need to cut losses.
“I don’t ever just base my entire decision off an indicator. So if an indicator isn’t agreeing with the trade thesis, then I simply will cut my losses,” Kellogg said. “So I’ve never ever blamed any of my losses ever on an indicator because I don’t let it get to that point. If the price action is continuing down, then I will cut my losses or if the price action is continuing up, then I’ll cover my short positioning.”
Everyone has access and can view the same data — it’s really about what you do with that data, he said. Where most traders struggle is with the psychology of trading. You can have the best strategy and indicators, but if you don’t have the discipline to stick to it, then you will constantly find yourself in a bad situation. Most people don’t put in enough effort to master their emotions, he said.
This story was originally published in March 2023.
Read the original article on Business Insider


