 As of April 15, 2024, bitcoin presents a mixed landscape of consolidation and subtle recovery hints, reflecting a crucial moment for potential bullish or bearish trends. Bitcoin Despite the current market indecisiveness indicated by the 1-hour chart, the 4-hour and daily charts suggest underlying movements that could influence future price actions. The 1-hour chart displays […]
Source link
momentum
Bitcoin Recovery Rally: Breaking Through This Level Is Key To Bullish Momentum
Over the past week, Bitcoin (BTC) has struggled to move significantly to the upside as the leading cryptocurrency has entered a consolidation phase below the $69,000 mark.
This subdued volatility departs from Bitcoin’s usual fluctuations, raising speculation about a potential stagnation phase in its market trajectory.
Anticipation Builds For Bitcoin’s Next Rally
The cryptocurrency community has closely monitored Bitcoin’s movements, especially as it approaches crucial resistance levels. Insights from prominent crypto analyst Captain Faibik shed light on Bitcoin’s current outlook.
Captain Faibik suggests that Bitcoin could be on the brink of a significant breakout, contingent upon surpassing the $70,000 resistance threshold. According to the crypto analyst, the BTC “Bulls must Clear the $70,000 Resistance area to Confirm the upside Breakout.”
$BTC is Bouncing back Nicely but still Consolidating within the Triangle.
Bulls must Clear the 70k Resistance area to Confirm the upside Breakout.#Crypto #Bitcoin #BTC pic.twitter.com/NxAz8Y1ktq
— Captain Faibik (@CryptoFaibik) April 5, 2024
Another crypto analyst, Jelle, Echoes similar sentiments and emphasizes the importance of patience among investors, particularly with the impending Bitcoin halving event on the horizon.
Notably, the Halving is a pre-programmed event built into the Bitcoin protocol that occurs approximately every four years within the Bitcoin network to reduce the reward for mining new BTC blocks.
Despite Bitcoin’s recent consolidation, anticipation for a potential rally above the $70,000 mark continues to build within the crypto community, especially as the halving is now less than 20 days away. This is because the halving ultimately decreases the supply of new BTC, and reduced supply often leads to increased demand and speculative buying.
Hope For Bitcoin Bull Run
Jelle’s analysis underscores the historical precedent of Bitcoin’s price movements, noting that previous all-time highs were often preceded by periods of consolidation and uncertainty.
Drawing attention to bullish indicators such as the pennant formation and strong support levels, Jelle predicts a breakout in the coming weeks, providing hope for investors seeking upward momentum in Bitcoin’s price trajectory.
While #Bitcoin did not break $69,000 in one go, it looks like it’s forming a new higher low here.
Hold $66,500, and we’ll be at $69k again soon.
Be patient – the halving is approaching fast. pic.twitter.com/LgMjodV4mF
— Jelle (@CryptoJelleNL) April 5, 2024
Meanwhile, current market data indicates a favorable environment for retail traders, with Glassnode reporting increased Bitcoin accumulation by short-term holders since December 2023.
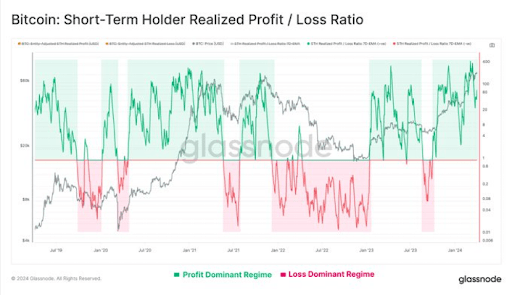
This trend suggests growing confidence among retail investors in Bitcoin’s long-term potential, further fuelling expectations for a potential rally beyond $70,000.
Featured image from Unsplash, Chart from TradingView
Disclaimer: The article is provided for educational purposes only. It does not represent the opinions of NewsBTC on whether to buy, sell or hold any investments and naturally investing carries risks. You are advised to conduct your own research before making any investment decisions. Use information provided on this website entirely at your own risk.
Amidst widespread bullish sentiment surrounding Bitcoin, one analyst on X thinks the leg up won’t be as strong as it was in the past few weeks. Pointing to developments in the Bitcoin log curves, the analyst expects the coin to find resistance as it attempts to break higher.
Bitcoin Uptrend To Slow Down
The analyst doubts the current excitement around the uptrend, and technical formations advise the contrarian view. Many in the industry think Bitcoin will not only ease past $70,000, a round number nearly tested this week, but also float to $100,000 in the next few weeks.
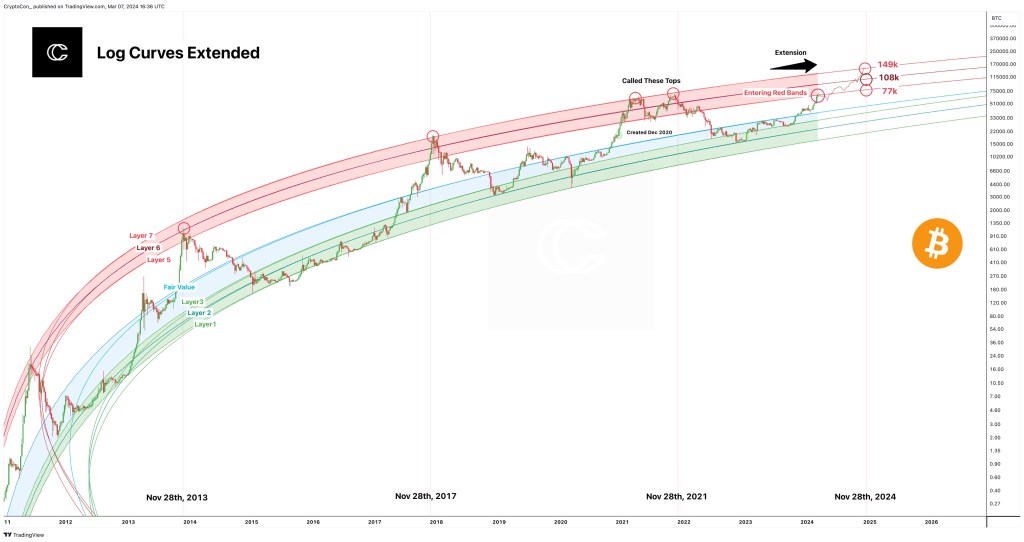
On X, the analyst remains confident about the coin’s prospects. However, based on the Bitcoin log curve assessment, the leg up will likely be labored. The analyst compares the current price formations with the Bitcoin log curves. In 2021, the tool was used to identify price peaks.
Based on price formation, the analyst notes that if BTC peaks in 2024, then prices will likely turn around from between $77,000 and $149,000. These prospective peaks’ upper and lower bands represent layers 5 and 7 of the log curve.
Even with BTC possibly rising to $149,000, at least from the tool, the Layer 7 target is relatively lower. By factoring in a one-year slowdown in growth, the predicted peak is revised downwards from $180,000 to $149,000.
When writing, the “red band” of the log curve has been breached earlier than usual. Looking back, Bitcoin prices tend to peak three months after this breakout.
That likely places Bitcoin’s peak at around the $77,000 level but below $100,000. Nonetheless, this is hard to predict, considering the volatile nature of prices and the dynamic nature of fundamental factors.
The community remains optimistic about what lies ahead. So far, Bitcoin prices have been trending at historical highs, but there has been a sharp drop in the momentum of upside.
BTC Bears In A Commanding Position
The daily chart shows that prices are still inside the bear bar of March 5. The candlestick had a high trading volume and was wide-ranging. For the uptrend to be valid, prices must break above $70,000, based on rising trading volume.
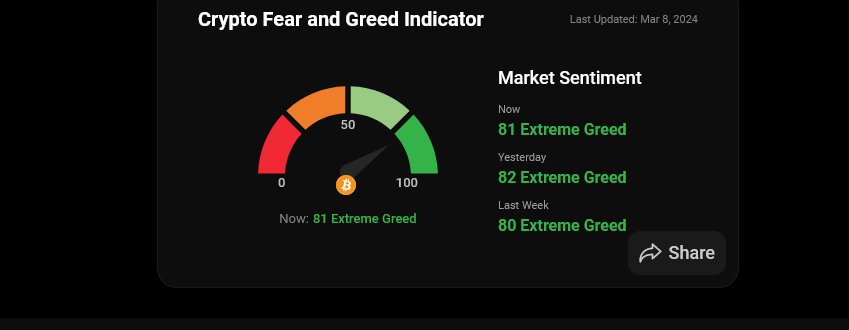
Lower prices incentivize issuers to spot Bitcoin exchange-traded funds (ETFs) to load up on dips. Their actions have spurred demand over the past few weeks, lifting sentiment and prices. According to Coinstats’ Fear and Greed Index, “extreme greed” exists in the market.
Feature image from DALLE, chart from TradingView
Disclaimer: The article is provided for educational purposes only. It does not represent the opinions of NewsBTC on whether to buy, sell or hold any investments and naturally investing carries risks. You are advised to conduct your own research before making any investment decisions. Use information provided on this website entirely at your own risk.
Technology stocks are riding high following Nvidia Corp.’s latest blockbuster earnings report, which helped push the Nasdaq-100 and the S&P 500 technology sector to fresh record highs last week.
But after looking past the index-level performance, there are signs that the momentum that has propelled the sector higher over the past year is starting to fade.
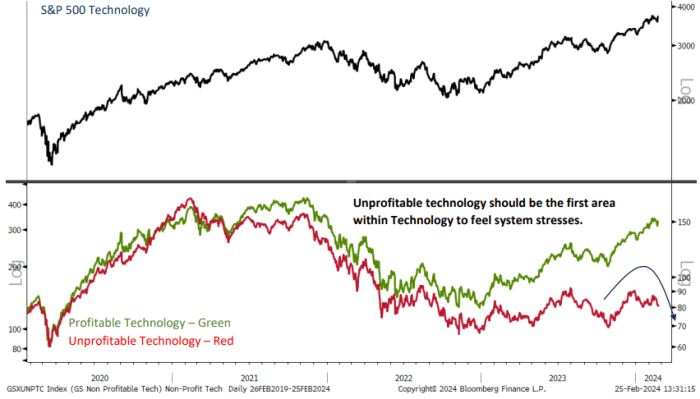
Unprofitable technology companies have started to roll over. Popular momentum gauges show the pace at which the average tech stock has outperformed the average S&P 500 stock has slackened. And the share of tech stocks trading above their medium-term averages has declined from its recent highs, although it remains well above 50%.
Meanwhile, valuations for the average technology stock have returned to their peak from November 2021, according to JC O’Hara, chief market technician at Roth MKM.
See: more stocks are joining the market’s rally — even as Big Tech still gets the most attention
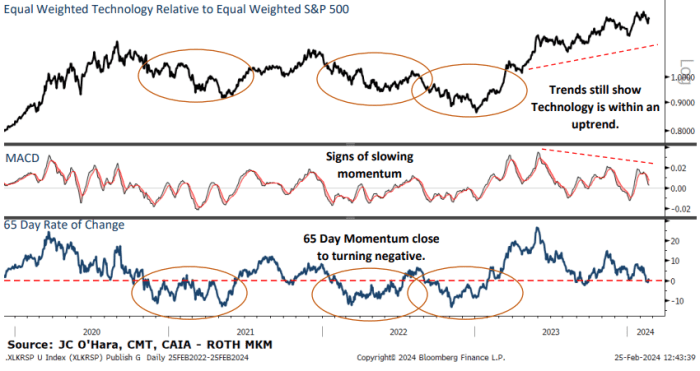
The average tech stocks’ relative momentum is starting to slow
While technology stocks remain firmly in an uptrend, their outperformance relative to the average S&P 500
SPX
stock has started to slow.
This is evidenced by a gauge of the average technology stocks’ outperformance compared with the average S&P 500 stock over the past 65 days, depicted in the chart below.
Such a shift has portended periods of underperformance for tech stocks in the past, not only in 2022, but in 2020 as well.
MKM ROTH
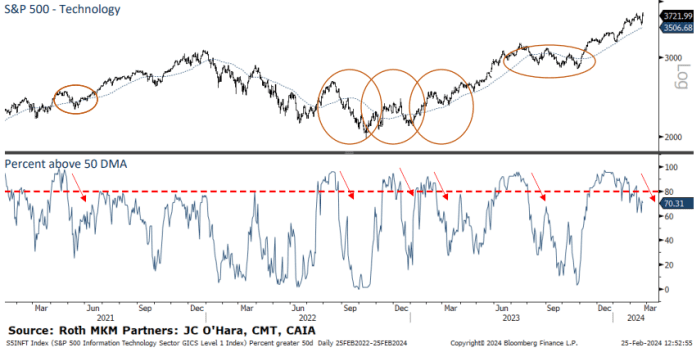
The share of technology stocks trading above their moving average is declining
Taken together, the S&P 500 technology sector is still trading well above its intermediate-term average. But more individual technology stocks have started to lag theirs.
By O’Hara’s count, roughly 70% of the tech sector’s 64 constituents are trading above their 50-day moving average as of Friday. By comparison, late last year, that number was 90%.
MKM ROTH
Valuations are looking stretched
Investors are paying a heavy premium for the average technology stock, evidenced by the trailing 12-month price-to-earnings ratio.
The ratio recently hit 35 times, a level that preceded the market peak from late 2021.
A version of the S&P 500 technology sector that assigns an equal weighting to each constituent stock only just took out those highs after more than two years. And during the interim, the gauge experienced a drawdown of more than 30%, according to O’Hara.

MKM ROTH
Options traders are getting greedy
Traders piled into bullish options ahead of Nvidia Corp.’s
NVDA,
earnings report last week. This pushed the 10-day put-call ratio, which measures demand for bullish options compared with demand for bearish options, firmly into greed territory.
However, history shows that options demand tends to mean revert, according to O’Hara. As of Friday, there was still plenty of room for options traders to shift from one side of the boat to the other.

MKM ROTH
Unprofitable technology stocks are fading fast
Even technology companies that haven’t posted steady profits saw their shares rocket higher as the broader market rallied furiously in November and December. Some analysts described it as a “dash for trash.”
But since the beginning of 2024, many of these companies that have struggled to post steady profits have seen their shares lurch lower. Case in point: The ARK Innovation ETF
ARKK,
seen as a proxy for unprofitable technology companies, is down 5.3% since the start of the year following a gain of more than 48% between Nov. 1 and Jan. 1, FactSet data show.
In the past, these companies have acted as a canary in the coal mine, O’Hara said.
“When market stresses start to develop, the unprofitable companies are normally sold first, as they are extremely far out on the risk curve and have the largest downside potential,” he added.
MKM ROTH
To be clear, O’Hara isn’t recommending that his clients rush to dump their technology stocks.
“We are still very much overweight Technology in our sector rankings,” O’Hara said.
But a recent spike in inquiries from clients asking for investment ideas outside of the tech piqued his curiosity.
He now expects a modest pullback that could carry the sector back below its 50-day moving average. This would equate to a drop of more than 4% for the XLK, according to FactSet data. The ETF was recently trading at $206.35 a share on Monday.
With that in mind, investors might want to consider buying some downside protection for their portfolios, he said. The lopsided put-call ratio means investors can purchase portfolio insurance relatively cheaply.
The tech-heavy Nasdaq-100
NDX,
which has the heaviest weighting toward the biggest megacap technology stocks like Nvidia Corp., hit its latest record close of the year on Thursday, while the Nasdaq Composite
COMP
came within a hair of its first record close since Nov. 19, 2021.
Meanwhile the S&P 500 and Dow Jones Industrial Average
DJIA
finished last week with their 13th and 14th record closing levels of the year, respectively.
All three of the main indexes — the S&P 500, Dow and Nasdaq Composite — were trading in the red early Monday afternoon.
Is The Trade Desk’s Business Momentum Good Enough to Justify Its Current Stock Price?
It would be difficult to criticize The Trade Desk‘s (TTD -0.58%) recent business performance. Everything seems to be going right for the company. Revenue is growing at robust double-digit rates, customer retention remains extremely high, and the company has a debt-free balance sheet and plenty of excess cash flow.
This financial success, of course, isn’t too surprising for those following the company closely. The programmatic advertising specialist’s product execution has been astounding in recent years. The Trade Desk’s fourth-quarter results were just more of the same. But there’s a looming question: Is the company living up to its current valuation?
Here’s a close look at some of the ways this tech company continues to impress investors.
Market share gains
One of the biggest things that stands out about The Trade Desk’s recent business performance is its market share gains. As The Trade Desk CEO Jeff Green pointed out in the company’s most recent earnings call, the ad tech specialist has grown its revenue faster than the rest of the digital advertising space in each of the last eight consecutive quarters.
In one specific example of its momentum relative to major peers in the space, The Trade Desk’s full-year 2023 revenue increased 23% year over year — and that’s on top of 32% growth in 2022. Compare that to Meta Platforms‘ and Alphabet‘s 16% and 9% year-over-year revenue growth rates in 2023, respectively.
Looking ahead, Green said in the company’s fourth-quarter earnings call that he expects top-line momentum to persist.
While there is much to celebrate about 2023, I’m even more excited about 2024 and beyond, I’ve never felt more confident heading into a new year. I believe we are uniquely positioned to grow and gain market share not only in 2024 but well into the future.
Product execution
Another aspect of The Trade Desk’s business worth applauding is its rapid pace of innovation.
The company’s biggest innovation in 2023 was its overhauled buy-side platform, Kokai. Green said that his product team recently visited nearly 1,000 clients and almost all of them said Kokai was a significant platform upgrade for them.
The Trade Desk also made notable progress in retail media (partnerships with retailers in which they bring data to its platform to share with advertisers). This is “one of the fastest-growing areas” of The Trade Desk’s business, Green said during the fourth-quarter earnings call.
But many other innovations are playing a key role in The Trade Desk’s customer approval. Some key innovations gaining steam with customers include The Trade Desk’s identity solutions UID2 and EUID, its direct pipeline to advertising inventory called OpenPath, and its connected television (CTV) integrations.
All of these factors help contribute to The Trade Desk’s high customer retention rate, which has remained above 95% for 10 years straight.
Robust financials
Lastly, The Trade Desk is a cash flow machine. Free cash flow, or the cash flow left after capital expenditures are accounted for, totaled $543 million in 2023. Such strong cash flow, combined with a debt-free balance sheet, means the company can fund its business growth while also returning cash to shareholders. The Trade Desk repurchased $220 million worth of its stock during Q4 alone and said in its earnings release last week that it has authorized $700 million for repurchases going forward.
All of these factors combine to help justify the stock’s current valuation of approximately 73 times free cash flow. With this said, shares certainly aren’t cheap. It might be wise for investors interested in buying the stock to wait and see if shares pull back to a valuation that leaves more room for error. But given the company’s strong execution, it would also be tough to call the stock overvalued at this point.
Suzanne Frey, an executive at Alphabet, is a member of The Motley Fool’s board of directors. Randi Zuckerberg, a former director of market development and spokeswoman for Facebook and sister to Meta Platforms CEO Mark Zuckerberg, is a member of The Motley Fool’s board of directors. Daniel Sparks has no position in any of the stocks mentioned. His clients may own shares of the companies mentioned. The Motley Fool has positions in and recommends Alphabet, Meta Platforms, and The Trade Desk. The Motley Fool has a disclosure policy.
Nvidia’s earnings report could kill the momentum driving U.S. stocks higher
Wall Street is growing increasingly uneasy about an options-driven momentum trade that has helped push the S&P 500 index into record territory.
As demand for bullish call options surges to its highest level in years, some analysts have set their sights squarely on Nvidia Corp.’s
NVDA,
Wednesday earnings report, warning that it could be the catalyst that slams the brakes on this trade, potentially reversing a substantial amount of the market’s rally over the past four months.
Their reasoning is rooted in the fact that investors have gotten so bulled up on risky options bets, the mere fact that the earnings report has passed could be enough to sink the main U.S. stock-market indexes due to the internal dynamics of the options market — even if Nvidia’s results satisfy Wall Street’s expectations, according to several derivative-market experts who spoke with MarketWatch.
According to FactSet, analysts expect Nvidia to report earnings per share of $4.59, an increase of more than 700% from the same quarter last year.
See: Nvidia may shine again when it reports on Wednesday
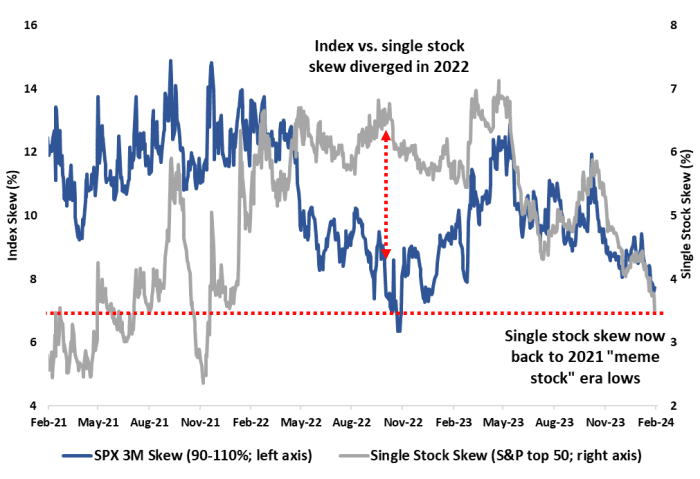
Traders pile into bullish options at fastest pace since 2021 meme-stock frenzy
As stocks rallied over the past year, taking many on Wall Street by surprise, investors have increasingly relied on options to chase the market higher and boost returns.
This has caused demand for bullish out-of-the-money calls on the largest U.S. stocks to approach the most skewed level since the meme-stock craze of 2021, according to data from Cboe Global Markets, one of the biggest options-exchange operators.
An option is said to be trading “out of the money” when the strike price of the option is above where the underlying stock or index is trading, in the case of calls, or below it, in the case of puts.
In the options market, “skew” typically measures demand for out-of-the-money calls compared with out-of-the-money puts, or demand for out-of-the-money puts or calls compared with their at-the-money counterparts. In this case, it is the former.
CBOE GLOBAL MARKETS
One key difference between the meme-stock era and the latest options-market frenzy is that this time around, more of the action is taking place in stocks that are heavily weighted in the main market indexes, said Michael Lebowitz, a portfolio manager at RIA Advisors.
“Option buyers are normally more insurance buyers. But now they’re more speculative traders, that’s what the skew is telling you,” he said during an interview with MarketWatch.
Michael Kramer, a longtime independent stock-market analyst and founder of Mott Capital, said Nvidia earnings could be a make-or-break moment for the market, but the odds are stacked against the chipmaker.
“The market in my opinion has placed a gigantic bet on one company,” Kramer said. “If Nvidia doesn’t guide up significantly, what is going to keep this thing going higher?”
With the stock already up nearly 50% this year, Nvidia has contributed roughly 25% of the S&P 500’s 4.9% advance since the start of 2024, Kramer said.
As of Thursday, the skew in Nvidia reached its highest level since June, according to data from SpotGamma, which provides data and analytics about the derivatives market.
Kramer said most of the stock’s advance over the past few months has been driven by aggressive call buying, which has forced options market makers to scoop up shares of the underlying stock to hedge their positions.
Rally poised to reverse after Nvidia earnings
While Nvidia has become the poster-child of the momentum trade, plenty of other stocks have gone along for the ride. That’s why Brent Kochuba, founder of SpotGamma, believes the broader market could decline next week, alongside Nvidia, as bullish call options tied to a swath of major U.S. companies are likely to cheapen after the chipmaker reports its earnings.
Once Nvidia’s earnings report has passed, implied volatility across the options market is likely to decline, Kochuba explained. This would be a typical reaction: implied volatility rises when investors see potentially market-moving events ahead that they want to hedge against, or speculate on. The opposite often happens when these events pass the market by.
As implied volatility falls, the options would get cheaper, while allowing the market makers that sold them to dump some of the stocks they accumulated to hedge their positions.
“Anything with a rich call skew could feel a bit more selling pressure” after Nvidia reports on Wednesday, Kochuba said in a note to clients shared with MarketWatch.
Options market makers typically buy stocks or index futures to hedge their positions since, if an option goes in the money, they could be on the hook to deliver the underlying stock.
Plenty of other technology names are seeing an extreme call option skew also, particularly semiconductor names like Advanced Micro Devices Inc.
AMD,
and Arm Holdings
ARM,
as well as other Big Tech giants like Microsoft Corp.
MSFT,
as traders bet that Nvidia’s rising tide could lift the broader information-technology sector.
Many on Wall Street, including Kramer, have been uneasy with the role the options market has played in driving the broader market higher since October, particularly as investors have reined in their expectations for the number of interest-rate cuts by the Federal Reserve this year, while earnings outside of a handful of megacap technology names have generally been lackluster, Kramer said.
The market’s torrid advance has left stocks to trade at their richest levels relative to their expected earnings in more than two years as major equity indexes like the S&P 500 and Nasdaq-100 have marched into record territory, while Wall Street analysts’ expectations for corporate earnings growth in 2024 have lessened.
The ratio of the S&P 500 relative to its expected full-year earnings recently topped 20 for the first time since early 2022, according to FactSet data, rising above its five-year and 10-year averages.
The forward price-to-earnings ratio for the Nasdaq-100
NDX
is even higher, and was trading north of 26 on Friday.
“Stocks aren’t trading on earnings momentum. They are trading on multiple expansion,” Mott Capital’s Kramer said.
Momentum begets momentum
To be sure, just because momentum has helped propel stocks higher, doesn’t mean traders can easily turn a profit by betting that the momentum will imminently reverse. As is often the case on Wall Street, momentum typically begets momentum.
“The pace of these rallies is not really sustainable — and in the case of something like Nvidia, it sets a pretty high bar to hurdle on earnings — but timing when the momentum fades is always the tough part,” said Bret Kenwell, U.S. options investment analyst at eToro.
U.S. stocks finished lower during the final trading session of the week, with the S&P 500
SPX
and Nasdaq Composite
COMP
snapping five-week winning streaks. The Dow Jones Industrial Average
DJIA,
on the other hand, managed to extend its winning streak to a sixth straight week.
Aside from Nvidia’s earnings, next week’s calendar of potentially market-moving events is looking pretty light, aside from the release of minutes from the Fed’s January meeting.
Bitcoin ETFs Threaten Gold’s Dominance As Digitalization Trends Gain Momentum
In just over a month since their approval by the US Securities and Exchange Commission (SEC), Bitcoin ETFs have swiftly gained traction in the market, posing a formidable challenge to the long-standing dominance of gold ETFs.
Bitcoin ETFs Gain Ground on Gold ETFs
The rapid rise of Bitcoin ETFs has led to a convergence in asset values, with BTC ETFs closing the gap with gold ETFs. Bitcoin ETFs hold approximately $37 billion in assets after only 25 trading days, while gold ETFs have accumulated $93 billion in over 20 years of trading.
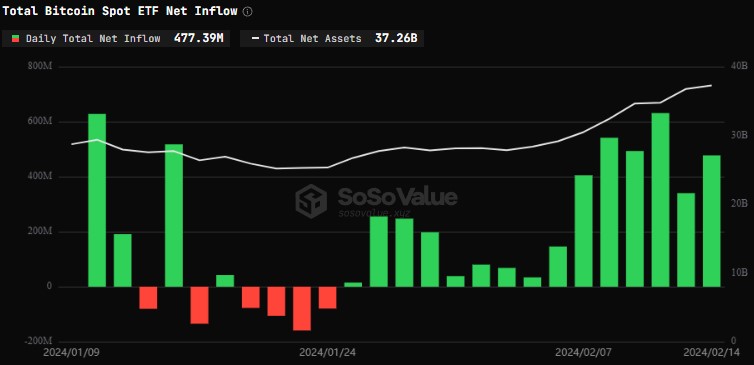
In this regard, Bloomberg’s Senior Commodity Strategist, Mike McGlone, emphasizes the shifting landscape, stating, “Tangible Gold is Losing Luster to Intangible Bitcoin.”
According to McGlone, the US stock market’s continued resilience, the US currency’s strength, and 5% interest rates have presented headwinds for gold. Moreover, as the world increasingly embraces digitalization, the emergence of Bitcoin ETFs in the United States adds further competition to the precious metal.
McGlone further states that while the bias for gold prices remains upward, investors who solely focus on gold may risk falling behind potential paradigm-shifting digitalization trends.
Ultimately, McGlone suggests that investors should consider diversifying their portfolios by incorporating Bitcoin or other digital assets to stay ahead in the evolving investment landscape.
Bitcoin Rally Driven By Institutional Demand
The success of Bitcoin ETFs is further demonstrated by recent data suggesting that the upward trend in Bitcoin prices is driven primarily by institutional demand. At the same time, retail participation appears to be declining.
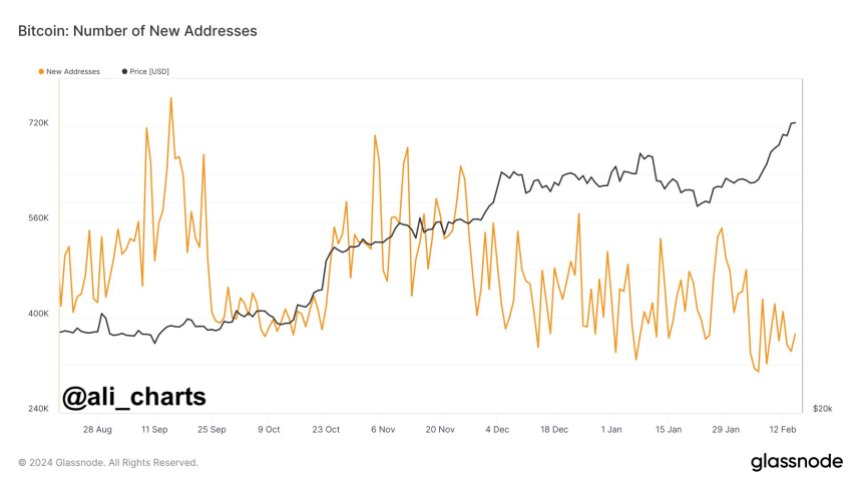
According to analyst Ali Martinez, as the price of Bitcoin continues to hover between $51,800 and $52,100, there has been a noticeable decrease in the creation of new Bitcoin addresses daily, indicating a lack of retail participation in the current bull rally and highlighting the growing influence of institutional investors in the cryptocurrency market.
However, market expert Crypto Con points out a significant shift in Long-Term Bitcoin holder positions, signaling a potential downside movement.
As seen in the chart below shared by Crypto Con, the position change line crossed below -50.00 for the first time in over a year, a pattern that has historically occurred at critical moments in Bitcoin’s market cycles. These moments include the cycle bottom, mid-top (which occurred only once), and the start/end of a cycle top parabola (which occurred most frequently).
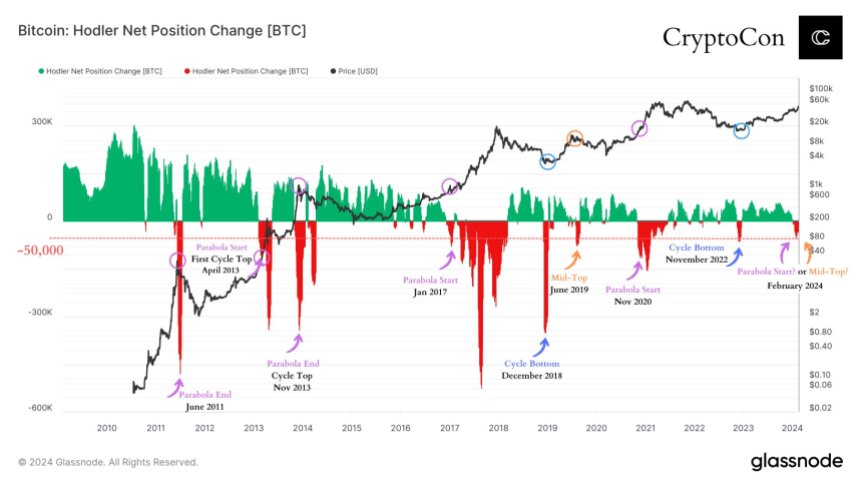
According to Crypto Con, this recent shift in long-term holder positions raises two possible scenarios: a mid-top or an imminent parabolic movement. Such a movement at this stage in the cycle is considered unusual.
Primarily, it indicates that long-term Bitcoin holders are exiting their positions in significant numbers, possibly anticipating a market correction or a change in the overall trend.
Overall, the shift in Bitcoin holder positions and the decline in retail participation present contrasting dynamics in the current market landscape. While institutional demand continues to drive the price of Bitcoin higher, long-term holders appear to be taking profit or adjusting their positions.
While BTC is currently trading at $51,800, it remains to be seen what the direction of the next move will be and how institutions will continue to influence the price action of the largest cryptocurrency as spot Bitcoin ETFs gain traction.
Featured image from Shutterstock, chart from TradingView.com
Disclaimer: The article is provided for educational purposes only. It does not represent the opinions of NewsBTC on whether to buy, sell or hold any investments and naturally investing carries risks. You are advised to conduct your own research before making any investment decisions. Use information provided on this website entirely at your own risk.
Bitcoin’s Price Soars Past $48K, Nears $1 Trillion Market Cap Amidst Bullish Momentum
 On Saturday, Feb. 10, 2024, bitcoin’s price soared beyond the $48K mark, reaching heights unseen since prior to Dec. 28, 2021. On Sunday, the leading digital currency maintained its robust momentum, consistently staying above the newly established price level. Over the last 24 hours, the crypto asset’s value has risen by over 2.6%, and it […]
Source link
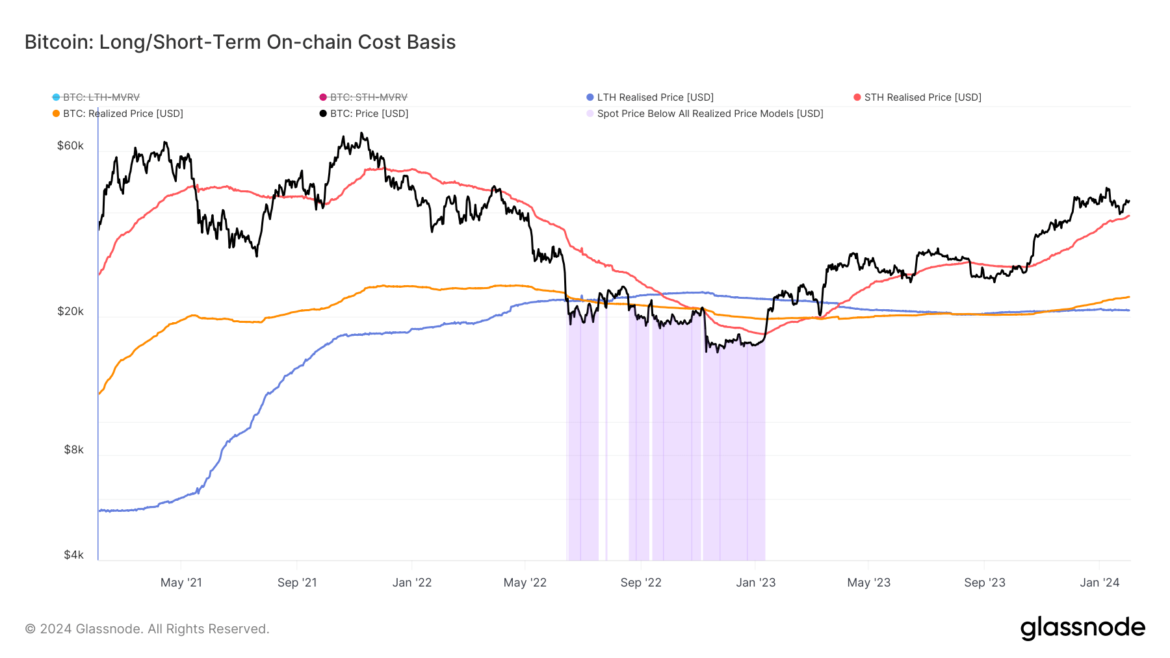
Bitcoin’s STH Realized Price nears $40,000, signaling strong market momentum

What is CryptoSlate Alpha?
A web3 membership designed to empower you with cutting-edge insights and knowledge. Learn more ›
Connected to Alpha
Welcome! 👋 You are connected to CryptoSlate Alpha. To manage your wallet connection, click the button below.
Oops…you must lock a minimum of 20,000 ACS
If you don’t have enough, buy ACS on the following exchanges:
Connect via Access Protocol
Access Protocol is a web3 monetization paywall. When users stake ACS, they can access paywalled content. Learn more ›
Disclaimer: By choosing to lock your ACS tokens with CryptoSlate, you accept and recognize that you will be bound by the terms and conditions of your third-party digital wallet provider, as well as any applicable terms and conditions of the Access Foundation. CryptoSlate shall have no responsibility or liability with regard to the provision, access, use, locking, security, integrity, value, or legal status of your ACS Tokens or your digital wallet, including any losses associated with your ACS tokens. It is solely your responsibility to assume the risks associated with locking your ACS tokens with CryptoSlate. For more information, visit our terms page.


