
Fitch Ratings downgrades China outlook to negative as economic concerns rise
Source link

Fitch Ratings downgrades China outlook to negative as economic concerns rise
Source link

The outlook for Binance Coin (BNB) has turned cloudy, with both futures market data and technical indicators flashing bearish signals. Based on our analysis of Coinglass data, negative funding rates and declining open interest in BNB futures contracts paint a picture of growing pessimism among traders.
A negative funding rate suggests that more traders are holding short positions, anticipating a decline in the price of the asset. This sentiment was confirmed on April 1st, when BNB’s funding rate dipped into negative territory at -0.012%.
Further fueling the bearish narrative, BNB’s futures open interest has also witnessed a slight decline of 0.15%. Open interest reflects the total amount of outstanding futures contracts that haven’t been settled yet.
A decrease in open interest suggests traders are exiting their positions without opening new ones, potentially signaling waning confidence in the market.

Source: Coinglass
Funding rates are a crucial mechanism in perpetual futures contracts that keep the contract price aligned with the spot price. When the contract price trades higher than the spot price, long position holders pay a fee to shorts, resulting in positive funding rates.
Conversely, negative funding rates materialize when the contract price dips below the spot price, indicating that short sellers are currently paying fees to longs.

Source: Coinglass
As negative sentiments mount, this open interest is expected to plummet further. This would imply that more traders are closing their positions and not opening new ones, suggesting a potential price drop for BNB.
The bearish sentiment isn’t confined to the futures market. The Moving Average Convergence Divergence (MACD), another technical indicator, is suggesting a possible resurgence in selling pressure.
There’s an indication that the MACD line might cross below the signal line, typically interpreted as a bearish sign signaling the return of sellers to the market. It’s noteworthy that since March 18th, the MACD lines for BNB have been positioned for a downtrend.
BNB market cap currently at $87.9 billion. Chart: TradingView.com
Considering both the futures market and technical analysis, there’s a potential for a short-term decline in BNB’s price. However, it’s important to acknowledge that market sentiment can shift rapidly, and technical indicators aren’t infallible predictors of future price movements.
At the time of writing, BNB was trading at $587, up 6% in the last 24 hours, data from CoinMarketCap shows.
Meanwhile, a closer look at BNB’s technical indicators on the 24-hour chart reveals another trend.
The Directional Movement Index (DMI), used to gauge trend strength, displayed a bearish crossover where the negative directional index sits above the positive directional index. This positioning suggests that bearish momentum is currently dominating the market.
Analysts commonly interpret this particular crossover as an imperative signal prompting traders to consider exiting long positions and initiating short positions.
This strategic move aligns with the prevailing trend indicated by the DMI, reinforcing the notion of a prevailing bearish sentiment within the market ecosystem.
Featured image from Pexels, chart from TradingView
Disclaimer: The article is provided for educational purposes only. It does not represent the opinions of NewsBTC on whether to buy, sell or hold any investments and naturally investing carries risks. You are advised to conduct your own research before making any investment decisions. Use information provided on this website entirely at your own risk.

The yen fell against the dollar on Monday after a report indicated the Bank of Japan was unlikely to exit its negative interest rate policy at the last meeting of 2023.
Central bank officials are waiting for more proof of sustained inflation and signs of wage growth before halting that decades-long policy, sources familiar with the matter told Bloomberg News. They said a final decision will be made by officials after a review of data between now and that meeting date, including financial market conditions and the quarterly tankan survey of economic conditions due Wednesday.
That may mean the Dec. 19 meeting will disappoint those who have been recently making bets that a big shift in policy was coming soon. Those expectations of a shift in policy were driven by comments last week by Bank of Japan Gov. Kazuo Ueda and Deputy Governor Ryozo Himino. Their remarks sent the yen and Japan bond yields soaring last Thursday.
But Monday saw the dollar
USDJPY
climb 0.7% against the yen to 146.10 yen. The 10-year Japanese government bond
,
though, rose 6 basis points to 0.78%. The Nikkei 225 index
,
one of 2023’s best global stock exchange performers with a rise of 25%, gained 1.5%.
Ahead of the Bank of Japan decision, the Federal Reserve, the Bank of England and the European Central Bank will all hold their last meetings of the year this week.

The gold price today is perhaps not doing what investors going long in the precious metal are hoping: to act as a hedge against both inflation and the potential deflation of other financial assets. So, what is the best strategy in the short term?
X
While some market professionals believe in gold’s long-term prospects, traders need to respect the market’s message.
Put another way: If the precious metal goes into a bigger correction, they need to cut losses and protect their overall portfolio.
Gold futures for October delivery dropped almost 1% on Friday to $1,864.60, according to Thinkorswim data. That marked a six-month low. Gold also slipped 9% below a 52-week high of $2,048 hit on May 4, based on Dow Jones Data. Talk about a brutal September for gold, as the commodity dived 5.2% for the month.
The drop on Friday also cut gold futures’ gain to 1.8% since Jan. 1. That raises the prospect that, with further decline, the return could go negative.
Check Out The 3o Most Trusted Financial Companies By Category
On Monday, gold futures in the December-expiration contract lopped off another 1.1% to $1,846 an ounce, breaking the $1,850 level for the first time since March 10.
Is gold’s performance since the start of January a measly return, compared with an 11.7% rise by the S&P 500 over the same time frame? Surely. From a longer time frame, the outperformance of U.S. equities vs. the shiny metal grows even starker.
Using MarketSmith’s performance comparison chart tool, the 500 has rallied 72.5% from March 31, 2020, near the bottom of the Covid pandemic bear market decline, through early Monday action. Much bigger than a 11.1% gain by SPDR Gold Shares (GLD), a popular exchange traded fund.
Why the big disparity?
IBD’s Big Picture: Nasdaq Tests 13,000 As Gold Gets Whacked
The biggest reason could simply be the strength of the U.S. dollar. Given that the shiny metal is priced in U.S. dollars in most of the major trading exchanges around the world, the ongoing strength in the buck vs. other key currencies likely makes gold more expensive to buy among foreign investors.
On Monday, the euro fell to $1.0481. Meanwhile, the U.S. greenback is selling for 149.83 Japanese yen, up more than 13% year to date.
As the accompanying monthly chart of Invesco DB U.S. Dollar Bullish (UUP), shows, the U.S. dollar has made a remarkable move higher since bottoming out in the summer of 2021. The Federal Reserve’s monetary tightening campaign has made U.S. Treasury securities more attractive given their higher yields. Overseas investors who want to own U.S. debt securities must purchase them with U.S. dollars.
That said, Ned Davis Research, in its latest macro strategy note sent to clients, holds a “Bullish” rating on gold and a “Bearish” grade on the U.S. dollar.
Budget Deadline Looms: How Will Stocks React To A Federal Shutdown?
The traditional notion about the gold price today as an expression of inflation fears still has relevance. When the prices of goods and services are raging, gold logically serves as a hedge. However, various measures of consumer and producer-level prices have shown that inflation peaked in the summer of 2022 and continues to fall.
Friday’s August PCE (personal consumption expenditures) index highlighted more progress on cooling inflation. The Econoday forecast saw the core U.S. PCE index edging up 0.2% in August vs. the prior month and increasing 3.9% year over year. Core PCE rose just 0.1%, below the consensus view, and 3.9% vs. a year ago, meeting the Econoday estimate.
In July, the core PCE index grew an upwardly revised 4.3% vs. a year earlier. That’s still below the current fed funds rate, or what large banks pay on overnight cash infusions from the Federal Reserve. So this means that in the U.S., real interest rates are positive. Holders of U.S. Treasury debt get can receive a positive return after accounting for inflation.
Research by the Federal Reserve Bank of Chicago done in 2021 finds that real interest rates also has a strong effect on gold. How so? When real interest rates are positive — as they are today — investors are encouraged to accumulate financial assets that actually provide either dividends or interest to the holders. Gold does not.
The Economist, in citing the Chicago Fed’s research, reported in its July 15, 2023, issue that “the metal will increase in price in inflationary periods if central banks are asleep at the wheel, and real rates fall, or if investors lose faith in the ability of policymakers to get it back under control. So far, neither has happened during this inflationary cycle.”
Meanwhile, the strength of the U.S. economy, despite the Federal Reserve’s 18-month-long policy move to raise short-term interest rates to 20-year-plus highs, also has made gold less attractive.
On Thursday, U.S. gross domestic product registered a 2.1% annualized gain in the second quarter vs. the prior quarter, according to final data. This reading drills holes through the argument that the U.S., for now, will return to its late 1970s era of stagflation — stagnant economic growth with high inflation.
Stock Market Forecast For Next 6 Months: What Investing Pros Are Watching Closely
A third reason to think gold prices today should go higher? The United States’ failure in recent decades to follow a balanced government budget has some investors worried about the future of the finances of the world’s No. 1 economy.
For decades after the end of World War II, the dollar was pinned to gold, thanks to the Bretton Woods agreement. But in August 1971, the Nixon Administration ended the gold standard for the U.S. dollar. Why? It hampered the government’s ability to increase spending for the Vietnam War and deal with a deficit in its balance of payments.
Without question, the dollar has replaced gold as the prime medium for global wealth, investing and trade.
Despite this severed connection between the gold price and fiscal and monetary policy, gold has attracted investors for its long-term price appreciation. Back in October 2003, gold futures traded between $366 and $393 per ounce. Two decades later, gold has enjoyed a nearly fivefold increase.
IBD’s Take In 2018: The Long-Term Bullish Case For Gold
| Symbol | Name | Current Price | % Off High | Market Cap (mil) | Comp Rating | EPS Rating | RS Rating |
|---|---|---|---|---|---|---|---|
| AGI | Alamos Gold | 11.43 | -19.05 | 4518.8 | 91 | 99 | 84 |
| KGC | Kinross Gold | 4.59 | -17.52 | 5622.8 | 87 | 92 | 78 |
| HMY | Harmony Gold Mining ADR | 3.88 | -28.55 | 2386.2 | 77 | 97 | 86 |
| IDR | Idaho Strategic Resources | 5.06 | -20.69 | 62 | 69 | 81 | 70 |
| EGO | Eldorado Gold | 8.96 | -26.01 | 1656.6 | 63 | 72 | 76 |
| BVN | Compania de Minas ADR | 8.49 | -4.82 | 2154 | 62 | 30 | 87 |
| GAU | Galiano Gold | 0.59 | -20.27 | 132.7 | 62 | 44 | 87 |
| DRD | DRDGOLD ADR | 8.36 | -39.64 | 722.8 | 59 | 82 | 70 |
| OR | Osisko Gold Royalties | 11.81 | -34.24 | 2188.4 | 58 | 98 | 27 |
| FNV | Franco-Nevada | 133.83 | -17 | 25681 | 55 | 81 | 48 |
| ORLA | Orla Mining | 3.79 | -24.5 | 1185.6 | 54 | 46 | 44 |
| BTG | B2Gold | 2.87 | -34.77 | 3086.4 | 53 | 94 | 20 |
| SILV | SilverCrest Metals | 4.5 | -40.48 | 662.5 | 52 | 81 | 14 |
| GFI | Gold Field ADR | 10.89 | -38.76 | 9707.1 | 51 | 81 | 48 |
| WPM | Wheaton Precious Metals | 40.47 | -23.29 | 18331.7 | 49 | 69 | 56 |
| RGLD | Royal Gold | 106.76 | -27.78 | 7012.9 | 48 | 87 | 41 |
| AU | AngloGold Ashanti | 16.33 | -11.15 | 6852.3 | 46 | 78 | 26 |
Meanwhile, a slide in gold price has spilled into heavy selling among gold mining stocks.
Barrick Gold (GOLD), one of the largest companies within IBD’s gold and silver mining industry group, nose-dived 7.9% for the week. Barrick shares slipped another 2.2% in above-average volume on Monday. At 14.23, GOLD shares have fallen 31% from a 52-week high and more than 55% below its 2020 peak of 31.22.
Never mind the additional statistic that Barrick Gold has also plunged more than 75% from its September 2011 high of 55.95. It currently holds a $25 billion stock market value and 1.76 billion shares outstanding.
IBD’s gold mining industry group headed into Monday’s trading ranked a dismal 190th out of 197 IBD industry groups as of six-month price-weighted performance. The group holds 74 companies. Eight stocks possess a Relative Strength Rating of 80 or higher. Only Alamos Gold (AGI) (99 Earnings Per Share Rating, 81 RS) trades for at least 10 a share.
Cheap Stocks To Buy And Watch: Gold Miner Makes IBD Screener
Going back to the state of gold prices today, Solita Marcelli, chief investment officer for the Americas at UBS (UBS), reasons that gold’s benefits as a safe haven remain intact.
“Our analysis shows that a mid-single-digit percentage allocation to gold in a balanced USD-based portfolio would have improved risk-adjusted returns and lessened drawdowns over recent decades,” Marcelli wrote in a recent client note emailed to IBD.
Marcelli adds that gold still can act as a “longer-term portfolio hedge especially in the context of an uncertain global growth outlook, volatile equity market dynamics, and unsettled geopolitics.”
UBS also cites data from the World Gold Council that central banks bought a net total of 55 metric tons of gold in June. These mighty players reversed three months of net selling. At the end of June, the gold price stood at $1,927 an ounce.
Finally, Marcelli’s team has found that a rise in gold buying by exchange-traded funds typically occurs just ahead of a cycle in easing U.S. interest rates. These market players saw outflows during the first half of 2023.
The future of the gold price today ultimately relays a noise-free message on the balance of supply vs. demand, whatever the reasons. Gold won’t rise again until demand becomes overwhelmingly strong.
Please follow Chung on X/Twitter: @saitochung and @IBD_DChung
YOU MAY ALSO LIKE:
William O’Neil, Legendary Investor And IBD Founder, Dies At 90
Stocks Near A Buy Zone
The Key To Big Gains In The Stock Market? Fewer Stocks, Not More
The Latest In IBD Videos
Learning How To Pick Great Stocks? Read Investor’s Corner

Ethereum price declined heavily below $1,800 and $1,700 against the US Dollar. ETH could resume its decline and test the $1,500 support zone.
Ethereum’s price started a major decline after it broke the $1,800 support zone. ETH gained bearish momentum after it traded below the $1,720 support, similar to Bitcoin.
The bears even pushed the price below the $1,600 level. Finally, it tested the $1,520 zone. A low is formed near $1,517 and the price is now attempting a recovery wave. There was a move above the $1,600 level. The price is now trading above the 50% Fib retracement level of the downward move from the $1,826 swing high to the $1,517 low.
Ether is now trading below $1,750 and the 100-hourly Simple Moving Average. There is also a key bearish trend line forming with resistance near $1,750 on the hourly chart of ETH/USD.
On the upside, the price might face resistance near the $1,700 level. It is close to the 61.8% Fib retracement level of the downward move from the $1,826 swing high to the $1,517 low. The next resistance is near $1,750 or the trend line.
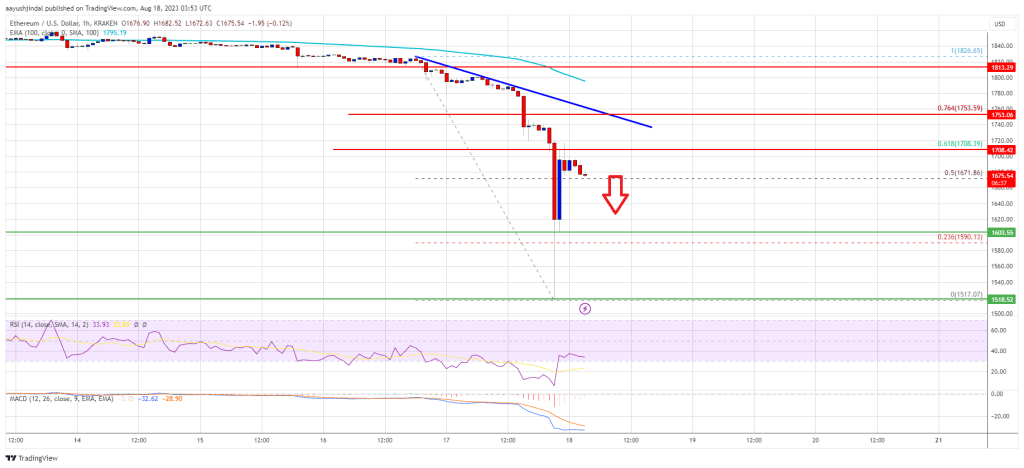
Source: ETHUSD on TradingView.com
A close above the $1,750 level could start a decent increase in the near term. The next major resistance is near the $1,800 level and the 100-hourly Simple Moving Average. Any more gains might send the price toward the $1,820 resistance, above which the price could rise toward the $1.880 zone.
If Ethereum fails to clear the $1,750 resistance, it could continue to move down. Initial support on the downside is near the $1,620 level.
The first major support is near the $1,550 zone. If the bulls fail to protect the $1,550 support, there could be more losses. The next major support is near the $1,520 support level. Any more losses might send the price toward the $1,500 level in the near term.
Technical Indicators
Hourly MACD – The MACD for ETH/USD is losing momentum in the bearish zone.
Hourly RSI – The RSI for ETH/USD is now below the 50 level.
Major Support Level – $1,620
Major Resistance Level – $1,750

Insufficient earnings on Twitter suggest that the platform’s advertising revenue may not have rebounded as quickly as previously anticipated.
Elon Musk, the CEO of Tesla and SpaceX, who also holds the position of CTO at Twitter, recently revealed the social media platform’s ongoing negative cash flow and the weight of its debt burden. Musk cited a 50% drop in advertising revenue and a significant debt burden as the reasons behind Twitter’s ongoing cash flow challenges.
Responding to a tweet about potential recapitalization options, the billionaire entrepreneur emphasized the need for Twitter to achieve positive cash flow before pursuing other endeavors. He further revealed that the popular social media platform he acquired for $44 billion did not witness the expected increase in advertising revenue in June but expressed some optimism for July.
We’re still negative cash flow, due to ~50% drop in advertising revenue plus heavy debt load. Need to reach positive cash flow before we have the luxury of anything else.
— Elon Musk (@elonmusk) July 15, 2023
Musk also said that July showed more promise in advertising revenue while acknowledging that Twitter Spaces and the audio chat feature are currently generating costs without bringing revenue to the company.
The new development highlights the ongoing struggle to achieve positive cash flow at Twitter, despite aggressive cost-cutting measures implemented since Musk’s acquisition of the company in October.
Since taking over Twitter, the Tesla CEO has implemented significant changes, including staff reductions and adjustments to content moderation policies. The billionaire wasted no time implementing a substantial workforce reduction, cutting 75% of Twitter’s global employees following the deal’s completion.
The move aimed to streamline operations and reduce costs. In addition to the workforce reduction, Musk revealed that Twitter has successfully slashed its projected non-debt expenditures from $4.5 billion to $1.5 billion for 2023. Moreover, the acquisition deal came with a substantial debt burden for Twitter. Due to the debt, the platform now faces annual interest payments of approximately $1.5 billion, adding further strain to its financial situation.
A New York Times report also disclosed that Musk failed to settle hundreds of thousands of dollars in outstanding bills owed to travel vendors. The company’s executives accumulated these expenses before the official acquisition in 2022.
Despite the cost-cutting measures and workforce restructuring, Twitter continues to grapple with negative cash flow. The social media platform has faced challenges with advertisers reducing or halting their ad spending due to concerns relating to content moderation and uncertainty about Twitter’s future.
Insufficient earnings on Twitter suggest that the platform’s advertising revenue may not have rebounded as quickly as previously anticipated. In an interview with the BBC in April, Musk indicated that most advertisers had returned to the platform, and he expected Twitter to become cash flow positive within the second quarter.
To address the issues of poor advertising revenue and other financial challenges at Twitter, Musk appointed Linda Yaccarino, a former NBCUniversal marketing executive, as Twitter’s new CEO. Yaccarino’s background in advertising is expected to prioritize the revitalization of Twitter’s ad business.
As such, the new CEO has outlined plans to focus on video, creator, and commerce partnerships and has engaged in early discussions with various entities, including political and entertainment figures, payments services, and news and media publishers.
Last week, Twitter announced a revenue-sharing program for selected content creators. However, some users expressed disappointment at the program’s limited scope, which is currently only available to Twitter Blue verified subscribers who meet certain criteria.
The program distributes a portion of the ad revenue generated from ads placed in replies to tweets. Several influencers and creators, including controversial figures like Andrew Tate, have revealed that they received payments through this program.
next

Chimamanda is a crypto enthusiast and experienced writer focusing on the dynamic world of cryptocurrencies. She joined the industry in 2019 and has since developed an interest in the emerging economy. She combines her passion for blockchain technology with her love for travel and food, bringing a fresh and engaging perspective to her work.
