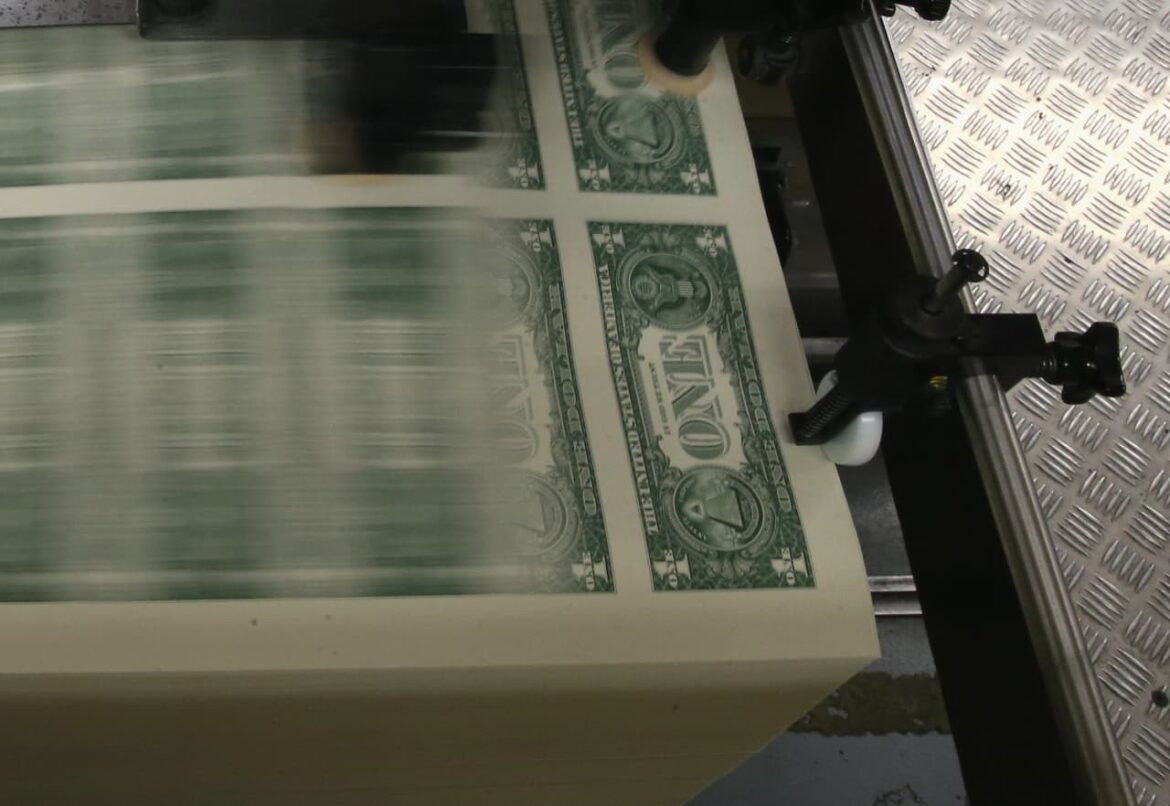
 PRESS RELEASE. Dubai, April 12, 2024: The Global Blockchain Show is pleased to announce Global Market of Artification (GMA) as its diamond sponsor at the upcoming two-day conference, set to take place at the Grand Hyatt, Dubai. Artworks by renowned masters like Rubens and Rembrandt will be featured at the event. With the inclusion of […]
Source link
show
XRP price is holding gains above the $0.60 zone. The price could gain bearish momentum if there is a close below the $0.570 support zone.
- XRP is facing a major hurdle near the $0.6580 zone.
- The price is now trading below $0.640 and the 100 simple moving average (4 hours).
- There is a key bearish trend line forming with resistance near $0.640 on the 4-hour chart of the XRP/USD pair (data source from Kraken).
- The pair could gain bearish momentum if there is a close below the $0.5720 support.
XRP Price Faces Uphill Task
After a steady decline, XRP price found support near the $0.5720 level. A low was formed at $0.5714 and the price started a fresh increase, like Bitcoin and Ethereum.
There was a move above the $0.5880 and $0.600 resistance levels. The price cleared the 23.6% Fib retracement level of the downward wave from the $0.7442 swing high to the $0.5714 low. The bulls pushed the price above the $0.620 resistance zone, but the bears are active near $0.640.
Ripple’s token price is now trading above $0.6320 and the 100 simple moving average (4 hours). On the upside, immediate resistance is near the $0.640 zone. There is also a key bearish trend line forming with resistance near $0.640 on the 4-hour chart of the XRP/USD pair.
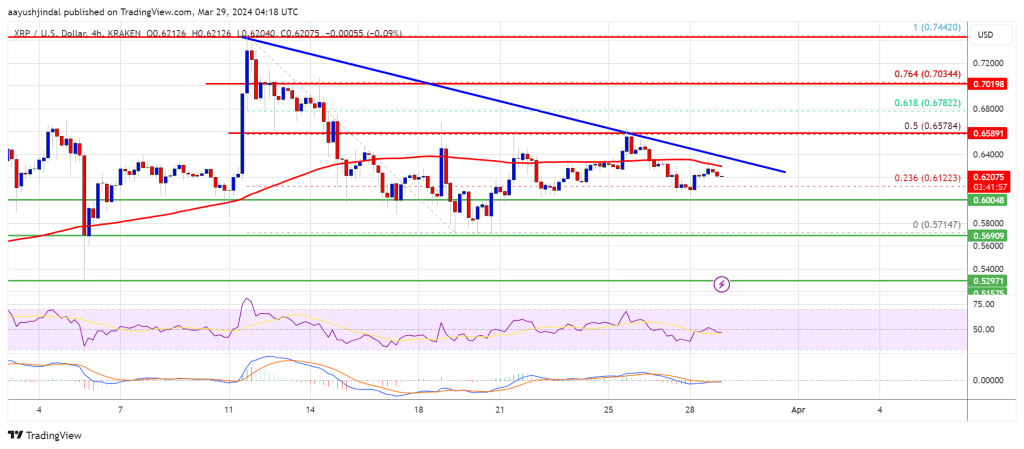
The next key resistance is near $0.6580. It is close to the 50% Fib retracement level of the downward wave from the $0.7442 swing high to the $0.5714 low. A close above the $0.6580 resistance zone could spark a strong increase. The next key resistance is near $0.700. If the bulls remain in action above the $0.700 resistance level, there could be a rally toward the $0.7440 resistance. Any more gains might send the price toward the $0.800 resistance.
More Losses?
If XRP fails to clear the $0.640 resistance zone, it could start another decline. Initial support on the downside is near the $0.600 zone.
The next major support is at $0.5720. If there is a downside break and a close below the $0.5720 level, the price might accelerate lower. In the stated case, the price could retest the $0.5250 support zone.
Technical Indicators
4-Hours MACD – The MACD for XRP/USD is now losing pace in the bullish zone.
4-Hours RSI (Relative Strength Index) – The RSI for XRP/USD is now above the 50 level.
Major Support Levels – $0.600, $0.5720, and $0.5250.
Major Resistance Levels – $0.640, $0.6580, and $0.700.
Disclaimer: The article is provided for educational purposes only. It does not represent the opinions of NewsBTC on whether to buy, sell or hold any investments and naturally investing carries risks. You are advised to conduct your own research before making any investment decisions. Use information provided on this website entirely at your own risk.
Recent Bitcoin buyers show unyielding optimism, pushing cost basis upward despite price surges
Quick Take
Utilizing data from Glassnode to estimate a market-wide cost basis reveals intriguing trends in the average price at which coins are withdrawn from exchanges. The information, segregated into cohorts, uncovers an upward trajectory on a cost basis, indicating a trend of purchasing Bitcoin at incrementally higher prices.
Most notably, the 2024 cohorts experienced a significant upswing, seeing an average profit margin of about $10,500, which translates to an approximately 20% gain from their initial cost basis ($52,478), according to data from Glassnode.
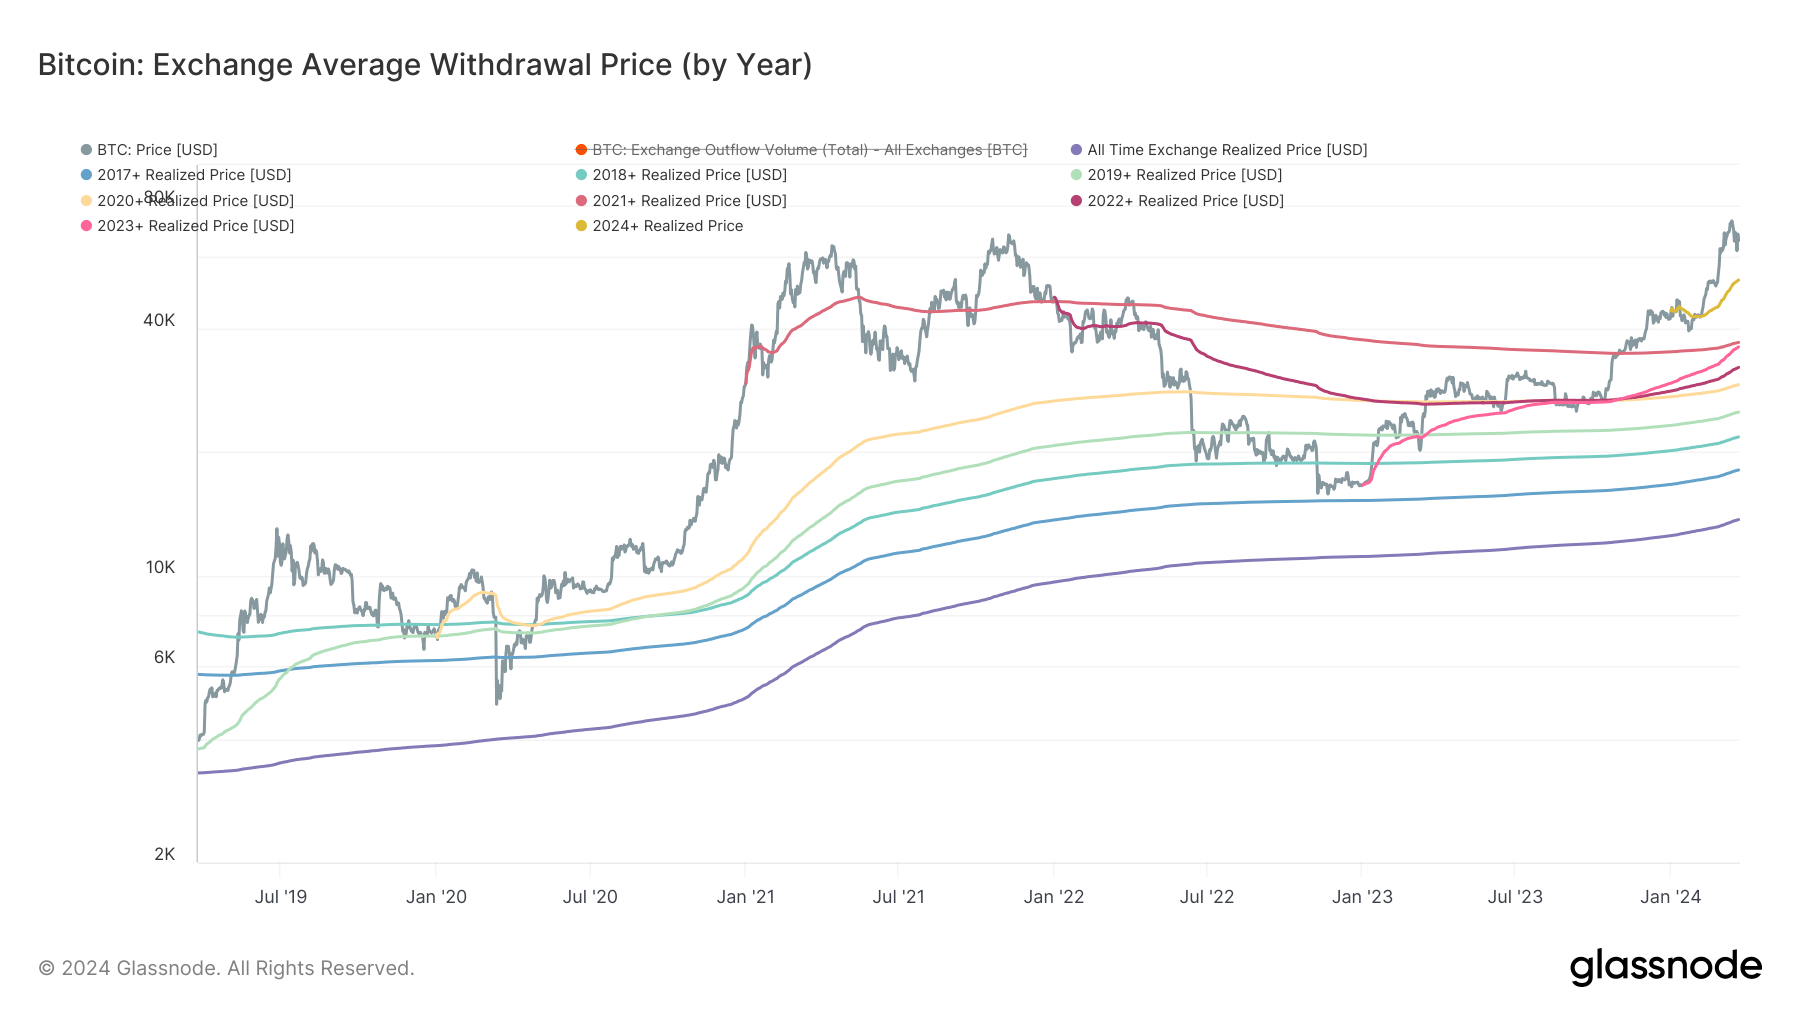
Interestingly, the 2021 cohort managed to significantly reduce their cost basis from $47,000 to a more conservative $36,971, as highlighted by recent CryptoSlate data analysis. Despite the reduction, the cost basis for all cohorts has risen in recent months, showing an unwavering dedication to buying Bitcoin regardless of increasing prices.
| Year | Price |
|---|---|
| All-time | $13,689 |
| 2017+ | $18,082 |
| 2018+ | $21,758 |
| 2019+ | $25,018 |
| 2020+ | $29,173 |
| 2021+ | $36,971 |
| 2022+ | $32,139 |
| 2023+ | $36,058 |
| 2024+ | $52,478 |
Source: Glassnode
The 2023 cohort, exhibiting the most bullish behavior, showcased a dramatic rise in cost basis from roughly $26,500 in October 2023 to a present figure of $36,058, suggesting a potential to surpass the 2021 cohort.
The post Recent Bitcoin buyers show unyielding optimism, pushing cost basis upward despite price surges appeared first on CryptoSlate.
3 Charts That Show How the Crypto Bull Market Is Just Getting Started
Finally, after two long years, things are picking back up in the crypto world. Since the beginning of the year, the total crypto market has grown by 35%, just 20% off from eclipsing its all-time high of $2.8 trillion in late 2021.
With such a significant jump, it’s reasonable to worry that crypto’s momentum may sputter, making an investment today too risky. However, when looking at the data, it appears crypto’s bull market has yet to hit a local peak.
In other words, while some gains may be behind us, there’s still plenty of potential in the crypto market. Let’s look at three charts showing how crypto’s best days remain ahead.
Breaking down Bitcoin
Since it makes up around half of the value in crypto, evaluating Bitcoin‘s (BTC -0.84%) current position can provide context on the market’s overall position. This is a chart of Bitcoin’s Market Value to Realized Value, better known as MVRV. Developed by analysts David Puell and Murad Muhmudov, MVRV divides Bitcoin’s market value by its realized value.
Market value is calculated by multiplying Bitcoin’s circulating supply by its current price. It is the same as the market capitalization. On the other hand, realized value is calculated by determining the price of each Bitcoin the last time it was involved in a transaction. This can provide a more granular insight into market dynamics, as it removes the generalization that every Bitcoin in circulation was purchased at the most recent price.
By dividing the two, we get the MVRV value and a better glimpse into Bitcoin’s current position. In fact, MVRV has historically proven to be a timely indicator of when the crypto market as a whole has topped or bottomed. With its current value at just 2.3, Bitcoin is far from levels of around 3.5 when bull markets tend to start losing steam.
Analyzing Coinbase trading volume
As one of the most popular crypto platforms in the world, we can extrapolate trading data from Coinbase Global (COIN 1.38%) to better understand the state of affairs in crypto. Similar to Bitcoin’s MVRV, trading volume on Coinbase shows there is still room for the crypto market to grow.
Based on the graph, it’s abundantly clear that investors have yet to make their way back to crypto. We can see that during the last bull market of 2021, trading volume on the platform surpassed more than $548 billion in Q4 alone. As of the most recent earnings report, total trading volume sits at just $154 billion, levels last seen when crypto was in the middle of a brutal crypto winter.
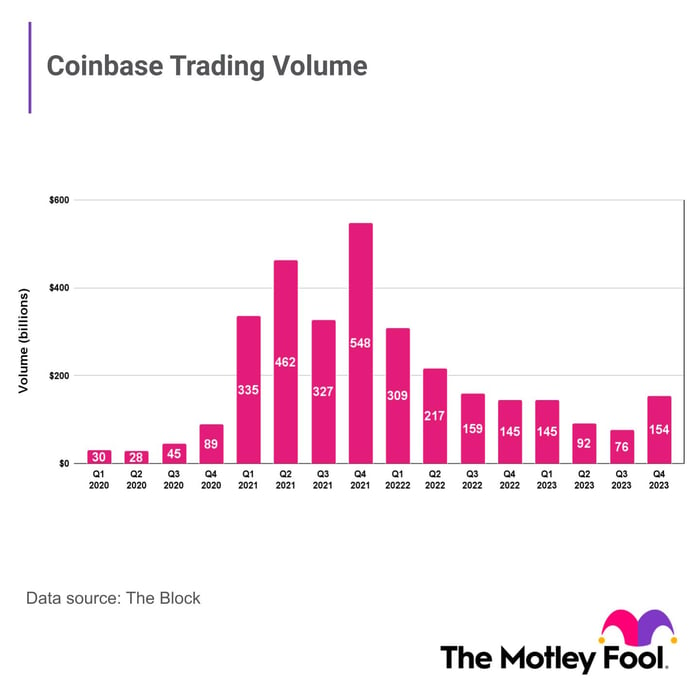
Data source: The Motley Fool.
Until these numbers get closer to that of the last bull market, there’s little reason to believe crypto’s recent surge is just scratching the surface. Even then, since crypto has historically notched new all-time highs with each bull-market cycle, don’t be surprised if the total volume in this cycle outdoes previous records.
Checking in on DeFi
Still in its beginning stages, decentralized finance (DeFi) is one of the most prominent use cases of cryptocurrencies and blockchain technology. Composed of non-fungible tokens (NFTs), stablecoins, lending protocols, and much more, the DeFi economy is brimming with innovative applications pushing the boundaries of finance.
There are several blockchains that make up DeFi. As of today, Ethereum (ETH -0.95%) dominates the space, but dozens of others are vying for market share.
With so many blockchains contributing to the DeFi economy, tracking its value can be a meaningful proxy to measure the crypto market’s progress and position. Currently in an uptrend due to the recent resurgence, the collective value of DeFi currencies is around $85 billion today.
Yet, this is still considerably off of its all-time high hit during the last bull run that peaked in November 2021. At the time, DeFi amassed a whopping value of more than $175 billion.
In a similar vein to trading volumes, it is safe to assume that due to DeFi’s burgeoning potential, it should surpass previous records. Should this prove to be the case, then there is plenty of catching up to do before we can even begin to consider crypto’s bull market to have peaked.
RJ Fulton has positions in Bitcoin, Coinbase Global, and Ethereum. The Motley Fool has positions in and recommends Bitcoin, Coinbase Global, and Ethereum. The Motley Fool has a disclosure policy.
Technology stocks are riding high following Nvidia Corp.’s latest blockbuster earnings report, which helped push the Nasdaq-100 and the S&P 500 technology sector to fresh record highs last week.
But after looking past the index-level performance, there are signs that the momentum that has propelled the sector higher over the past year is starting to fade.
Unprofitable technology companies have started to roll over. Popular momentum gauges show the pace at which the average tech stock has outperformed the average S&P 500 stock has slackened. And the share of tech stocks trading above their medium-term averages has declined from its recent highs, although it remains well above 50%.
Meanwhile, valuations for the average technology stock have returned to their peak from November 2021, according to JC O’Hara, chief market technician at Roth MKM.
See: more stocks are joining the market’s rally — even as Big Tech still gets the most attention
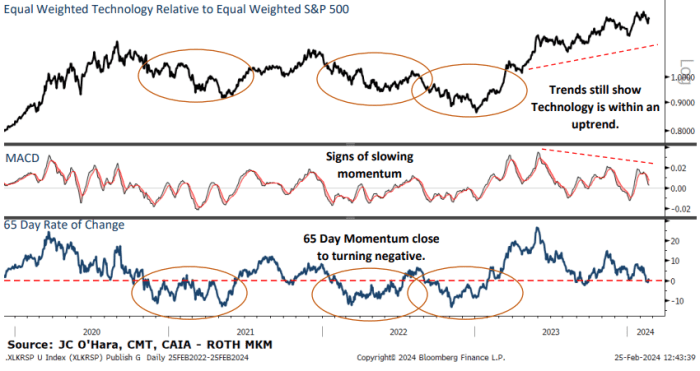
The average tech stocks’ relative momentum is starting to slow
While technology stocks remain firmly in an uptrend, their outperformance relative to the average S&P 500
SPX
stock has started to slow.
This is evidenced by a gauge of the average technology stocks’ outperformance compared with the average S&P 500 stock over the past 65 days, depicted in the chart below.
Such a shift has portended periods of underperformance for tech stocks in the past, not only in 2022, but in 2020 as well.
MKM ROTH
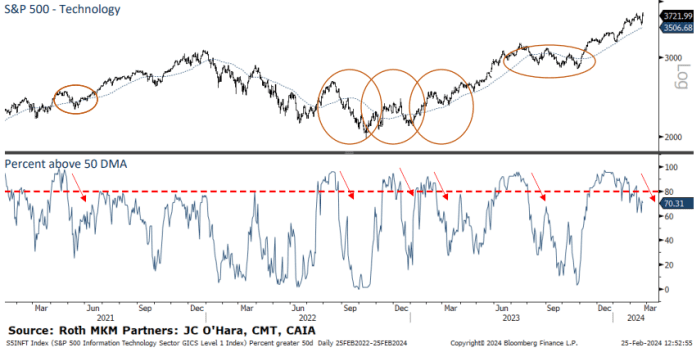
The share of technology stocks trading above their moving average is declining
Taken together, the S&P 500 technology sector is still trading well above its intermediate-term average. But more individual technology stocks have started to lag theirs.
By O’Hara’s count, roughly 70% of the tech sector’s 64 constituents are trading above their 50-day moving average as of Friday. By comparison, late last year, that number was 90%.
MKM ROTH
Valuations are looking stretched
Investors are paying a heavy premium for the average technology stock, evidenced by the trailing 12-month price-to-earnings ratio.
The ratio recently hit 35 times, a level that preceded the market peak from late 2021.
A version of the S&P 500 technology sector that assigns an equal weighting to each constituent stock only just took out those highs after more than two years. And during the interim, the gauge experienced a drawdown of more than 30%, according to O’Hara.

MKM ROTH
Options traders are getting greedy
Traders piled into bullish options ahead of Nvidia Corp.’s
NVDA,
earnings report last week. This pushed the 10-day put-call ratio, which measures demand for bullish options compared with demand for bearish options, firmly into greed territory.
However, history shows that options demand tends to mean revert, according to O’Hara. As of Friday, there was still plenty of room for options traders to shift from one side of the boat to the other.

MKM ROTH
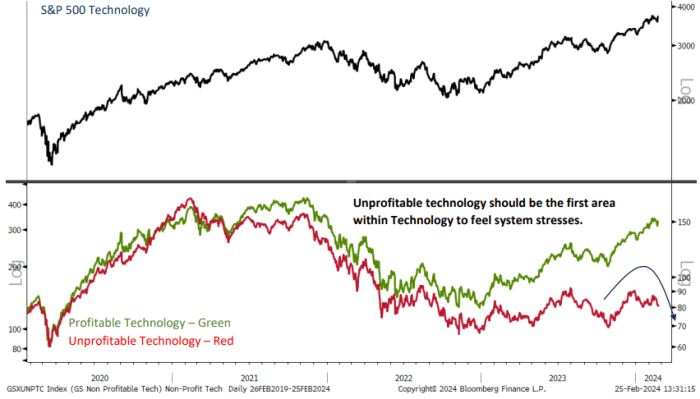
Unprofitable technology stocks are fading fast
Even technology companies that haven’t posted steady profits saw their shares rocket higher as the broader market rallied furiously in November and December. Some analysts described it as a “dash for trash.”
But since the beginning of 2024, many of these companies that have struggled to post steady profits have seen their shares lurch lower. Case in point: The ARK Innovation ETF
ARKK,
seen as a proxy for unprofitable technology companies, is down 5.3% since the start of the year following a gain of more than 48% between Nov. 1 and Jan. 1, FactSet data show.
In the past, these companies have acted as a canary in the coal mine, O’Hara said.
“When market stresses start to develop, the unprofitable companies are normally sold first, as they are extremely far out on the risk curve and have the largest downside potential,” he added.
MKM ROTH
To be clear, O’Hara isn’t recommending that his clients rush to dump their technology stocks.
“We are still very much overweight Technology in our sector rankings,” O’Hara said.
But a recent spike in inquiries from clients asking for investment ideas outside of the tech piqued his curiosity.
He now expects a modest pullback that could carry the sector back below its 50-day moving average. This would equate to a drop of more than 4% for the XLK, according to FactSet data. The ETF was recently trading at $206.35 a share on Monday.
With that in mind, investors might want to consider buying some downside protection for their portfolios, he said. The lopsided put-call ratio means investors can purchase portfolio insurance relatively cheaply.
The tech-heavy Nasdaq-100
NDX,
which has the heaviest weighting toward the biggest megacap technology stocks like Nvidia Corp., hit its latest record close of the year on Thursday, while the Nasdaq Composite
COMP
came within a hair of its first record close since Nov. 19, 2021.
Meanwhile the S&P 500 and Dow Jones Industrial Average
DJIA
finished last week with their 13th and 14th record closing levels of the year, respectively.
All three of the main indexes — the S&P 500, Dow and Nasdaq Composite — were trading in the red early Monday afternoon.
MicroStrategy’s leverage scenarios show potential for astronomical returns on Bitcoin investments
Quick Take
In its Q4 earnings report, MicroStrategy disclosed its substantial Bitcoin investment in Q4 2023 of $1.25 billion, which is now worth a staggering $8 billion. The firm holds 190,000 BTC in its corporate treasury.
MicroStrategy’s Q4 2023 Earnings Presentation shows that this strategic decision has paid dividends, as its stock has surged by 305% since it started investing in Bitcoin in August 2020. For comparison, Bitcoin itself saw an increase of 260% during the same period, while more traditional assets lagged behind, with the S&P 500 and gold only increasing by 48% and 1%, respectively, according to MicroStrategy data.
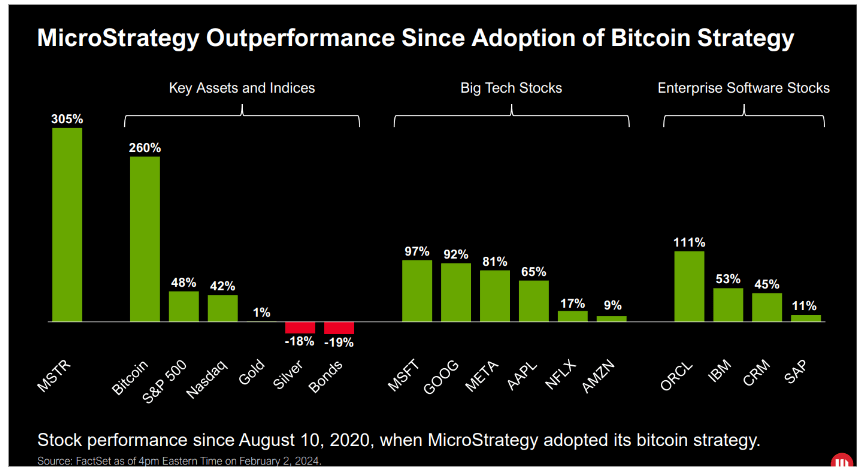
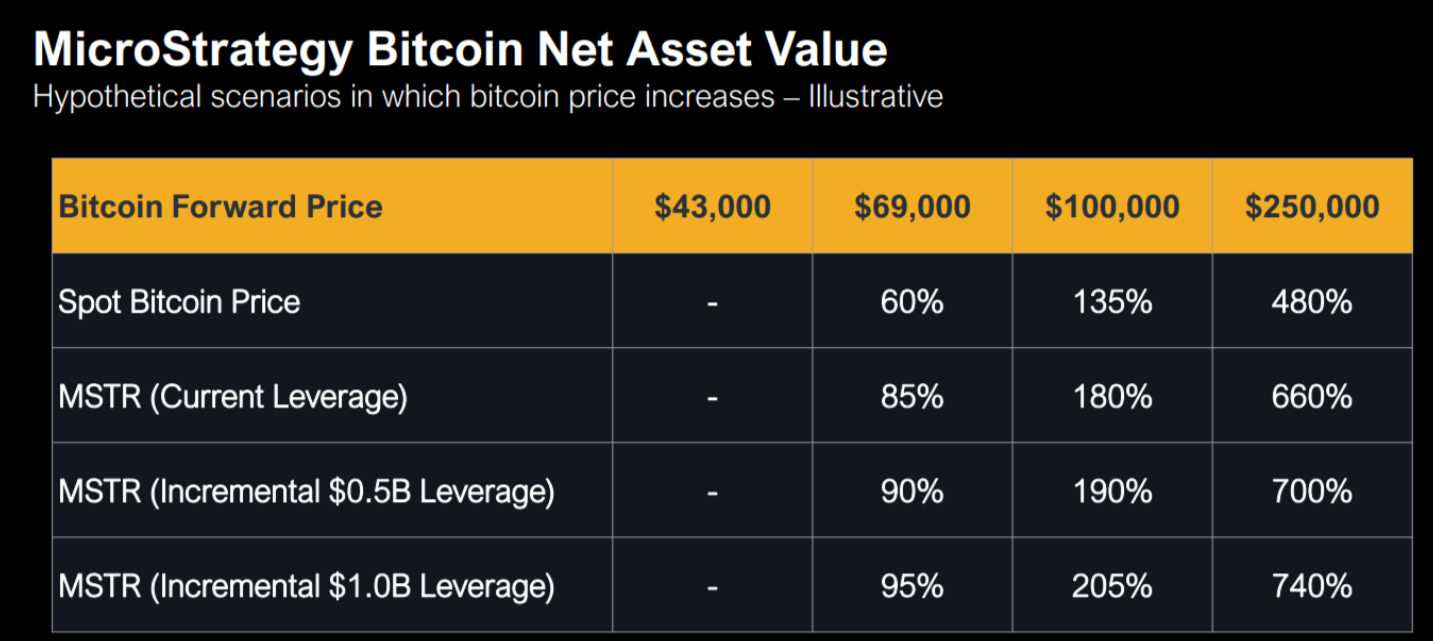
Furthermore, MicroStrategy presented hypothetical scenarios in the earnings presentation based on their net asset value, calculated as their Bitcoin holdings market value minus total outstanding debt.
These scenarios considered varying Bitcoin spot prices and the effect of adding leverage. For instance, if Bitcoin’s price rose from $43,000 to $69,000, this would result in a 60% increase, scaling up to a 135% increase if Bitcoin hit $100k and a whopping 480% surge if Bitcoin reached $250k, MicroStrategy data shows.
As MicroStrategy reported, adding the company’s existing leverage would further enhance returns, potentially by 85% at a Bitcoin price of $69,000 and up to 660% if Bitcoin soared to $250k. An additional scenario illustrated how a further $0.5B of leverage could substantially augment these returns.
The post MicroStrategy’s leverage scenarios show potential for astronomical returns on Bitcoin investments appeared first on CryptoSlate.
Bitcoin CME futures and Coinbase show renewed premiums as institutional interest spikes
Quick Take
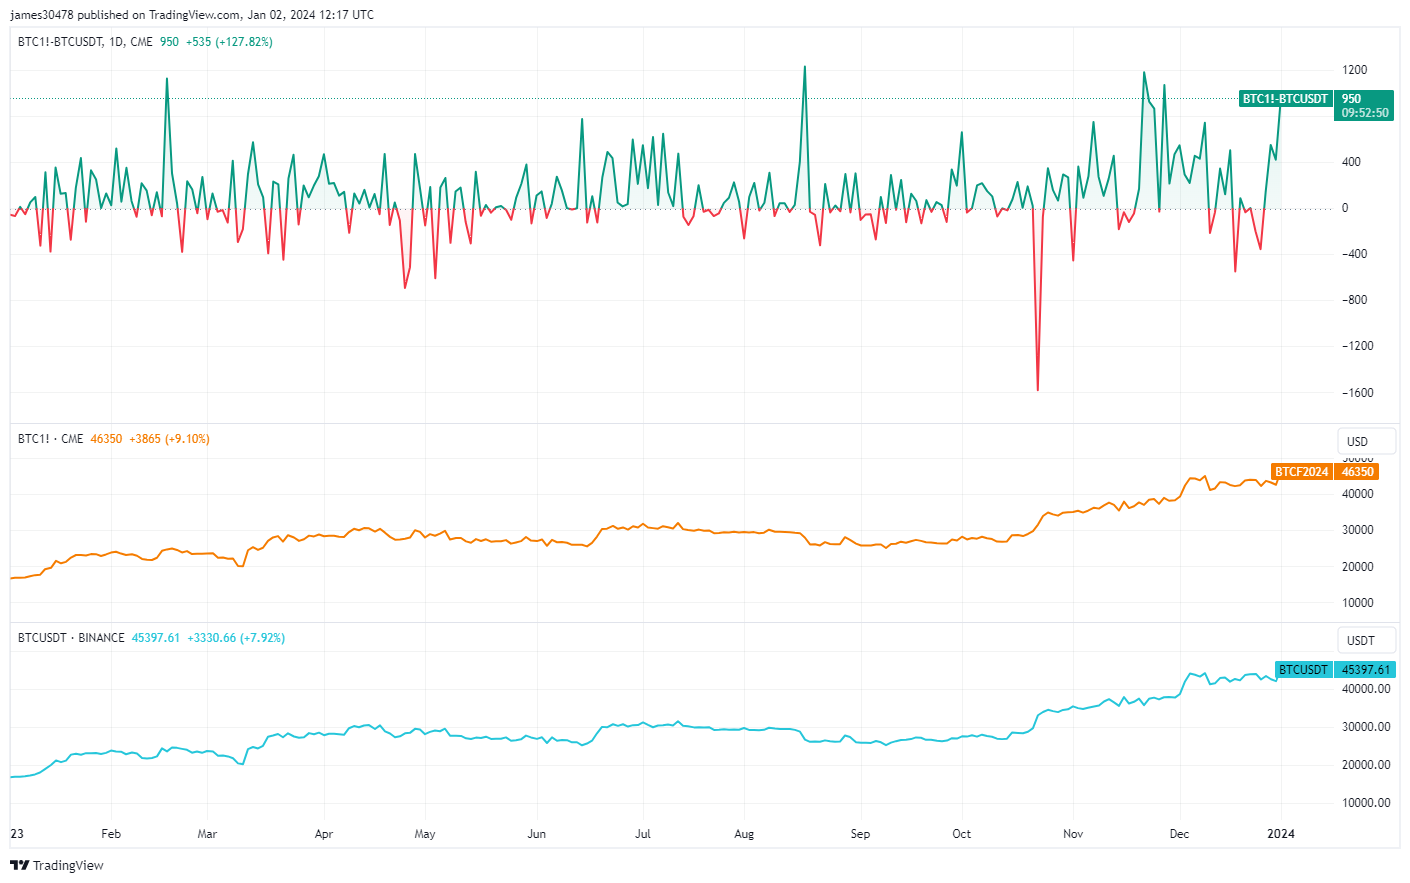
A notable development ensues as Bitcoin enters 2024 with the reappearance of premiums on both Chicago Mercantile Exchange (CME) futures and Coinbase. Data analysis reveals a discernible price discrepancy between CME’s Bitcoin futures, trading approximately at $46,400, and Binance’s BTCUSDT pair, exchanging hands at about $45,300. This almost $1,000 variance emerges as the fifth-largest differential observed in the past year.
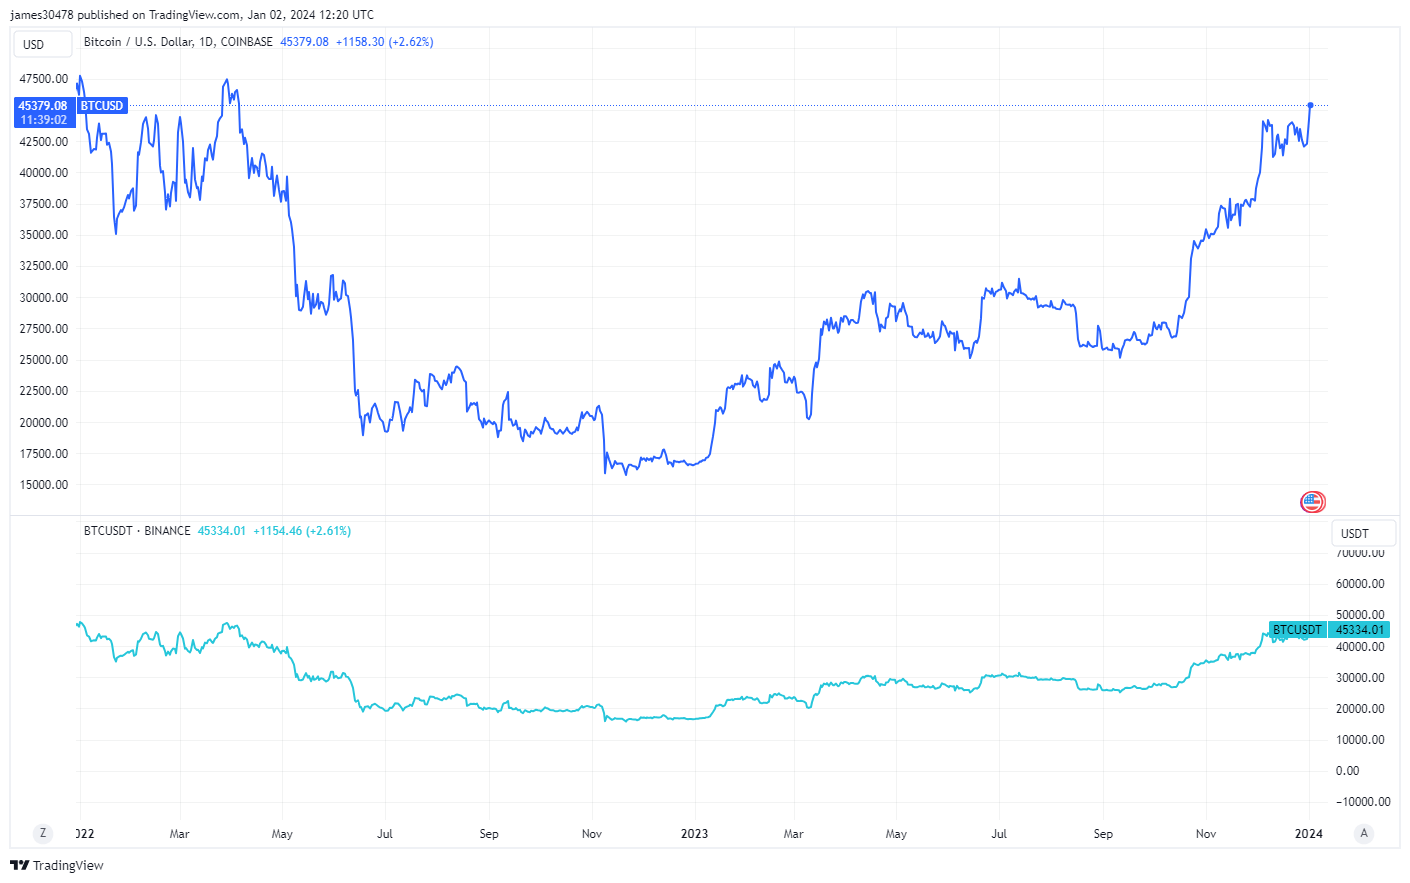
Further, the Coinbase premium, too, has made a comeback. The BTCUSD pair on Coinbase is seen trading for $45,400, in contrast to the BTCUSDT pair, set at $45,300. This evolving landscape indicates a resurgence in institutional interest, primarily from the United States, coinciding with the potential approval of a Bitcoin spot Exchange-Traded Fund (ETF).
While the dynamics of this resurgence are multifaceted, it is clear that the potential approval of the spot ETF may have a major role in this shift.
The post Bitcoin CME futures and Coinbase show renewed premiums as institutional interest spikes appeared first on CryptoSlate.
E3, the once-massive videogame trade show, has been permanently canceled
It’s game over for E3.
In a tweet Tuesday, the trade group that ran the once-blockbuster annual videogame conference said it was permanently pulling the plug on the Electronic Entertainment Expo.
“The time has come to say goodbye,” the Entertainment Software Association said, adding “GGWP,” gamer slang for “good game, well played.”
The first E3 was held in 1995, but the event had not convened in person since 2019, before the onset of the COVID-19 pandemic. It held a virtual event in 2021, but E3 had been canceled for the past two years, though there had been hints it would eventually come back.
E3 was once a yearly highlight for the videogame industry, especially in the days before social media, with tens of thousands of retailers, creators, industry insiders and media members gathering in Los Angeles, as companies showed off new consoles and previewed upcoming games. The event was not open to the general public until 2017.
In an interview with the Washington Post, ESA CEO Stanley Pierre-Louis confirmed E3’s permanent cancellation, and acknowledged that the times had passed it by.
“There were fans who were invited to attend in the later years, but it really was about a marketing and business model for the industry and being able to provide the world with information about new products,” he told the Post. “Companies now have access to consumers and to business relations through a variety of means, including their own individual showcases.”
The event’s downfall started in 2018, when Sony’s
SONY,
PlayStation pulled out. This year’s E3 was canceled after Microsoft Corp.
MSFT,
Nintendo Co.
7974,
and Ubisoft Entertainment
UBI,
said they wouldn’t be participating.
Bond yields rise as jobs data will show whether rally has been warranted
Bond yields rose on Friday ahead of pivotal data that will show whether a rally in bond prices has been justified.
What’s happening
-
The yield on the 2-year Treasury
BX:TMUBMUSD02Y
was 4.63%, up 4.1 basis points. Yields move in the opposite direction to prices. -
The yield on the 10-year Treasury
BX:TMUBMUSD10Y
was 4.18%, up 2.7 basis points. -
The yield on the 30-year Treasury
BX:TMUBMUSD30Y
was 4.28%, up 2.5 basis points.
What’s driving markets
Economists expect the U.S. Labor Department to report 190,000 jobs were created in November when the employment situation report is released at 8:30 a.m. Eastern.
Strategists at ING point out that the jobs forecast, when accounting for striking auto workers going back to work, is pretty much is in line with the 150,000 per month “replacement rate” needed for the U.S. economy to absorb a growing population.
Noting the U.S. 10-year has moved off a peak of about 5%, “[the yield decline] really needs some validation of that move from today’s report,” they say.
Next week will feature two long-end auctions as well as CPI data and the Federal Open Market Committee meeting.


