There are a handful of signals that point to the strong US consumer finally slowing down.
Macquarie strategist Thierry Wizman, foresees the US economy slipping into a consumer-led slowdown.
He said a downturn could hit sometime between now and the end of the first quarter of 2024.
American consumers are finally showing signs of slowing as they blow through their savings, and there are a handful of warning signs that the economy could soon tip into a spending recession.
Thierry Wizman, a strategist at Macquarie Global, foresees the US economy slipping into a consumer-led slowdown sometime between now and the end of the first quarter in 2024. A major pullback in consumer spending could force GDP growth to grind to halt, he told Insider, pushing the overall economy into borderline recession territory.
Wizman’s downbeat forecast is counter to what other commentators have said, as consumers have kept up their spending spree over the third quarter in a row this year. Retail sales, jumped 0.7% during the month of September, more than double what economists were expecting.
But the resilient spending is itself the problem: spending has been so strong, it’s bound to whiplash in the other direction as savings run dry and Americans financial situations change, Wizman said.
“There were reasons why Q3 was very strong. Getting through all the revenge travel … the concert tours,” Wizman said. “The problem, of course, is that it’s usually followed by a hangover.”
“Like all hangovers, this one will happen soon after the binge,” he added in a note this week.
The economy is now flashing a handful of warning signs that the US consumer is running out of steam. Here are five signals of weakness that point to a spending recession on the way.
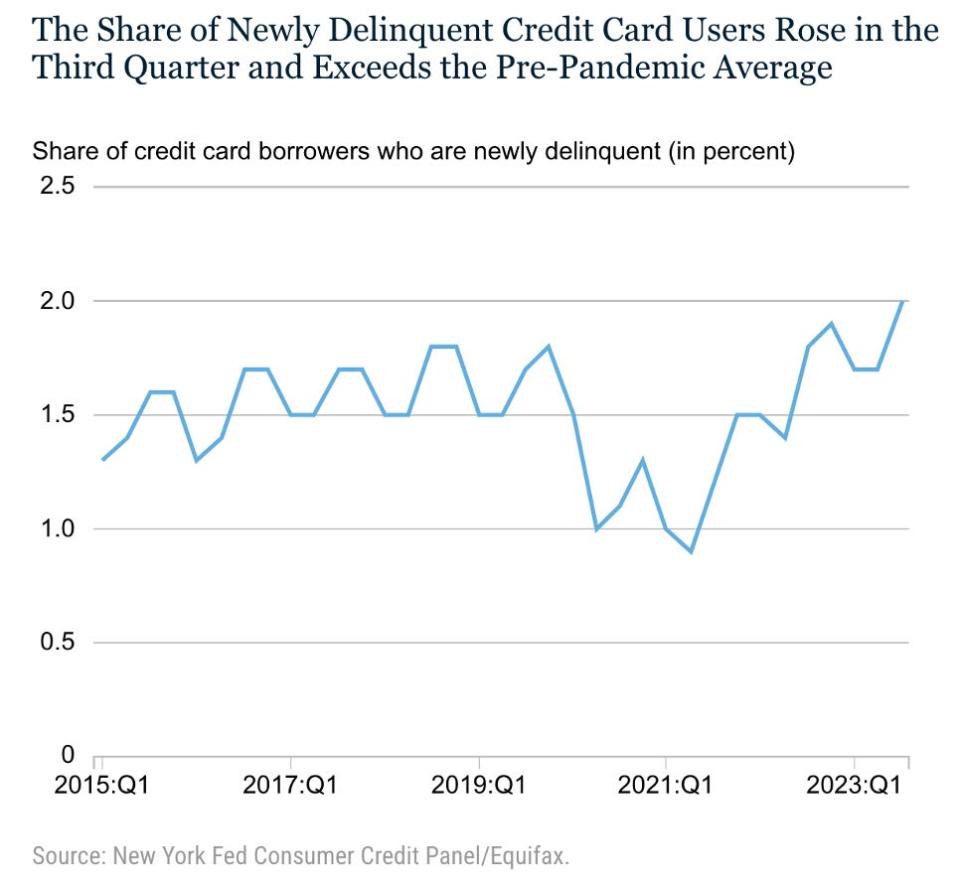
1. Credit card delinquencies are rising
Newly delinquent credit card users are rising.New York Fed/Equifax
Credit card holders that became newly delinquent rose to 2% the last quarter, about double the rate recorded in the first quarter of 2021. Meanwhile, Americans who were seriously late in paying their credit card balances – by at least 90 days – rose to nearly 6% the last quarter, according to the New York Fed’s latest Household Debt and Credit report.
Credit card delinquencies also saw a particularly high jump for those who already had auto and student loan debt, the report added. That’s a sign financial stress is growing, Wizman said, which is likely to lead people to pull back on spending.
2. Americans are saving less
The personal savings rate slumped to 3.4% in September.Federal Reserve/Bureau of Economic Analysis
The personal savings rate slumped further last month. Americans saved an average 3.4% of their disposable personal income in September, down from 4% in August, according to the Bureau of Economic Analysis. That’s well-below the pre-pandemic savings rate, when Americans were stashing away around 7% of their disposable personal income.
“That’s actually very, very low compared to historic norms,” Wizman said of the current savings rate. “So there has to be at some point an adjustment.”
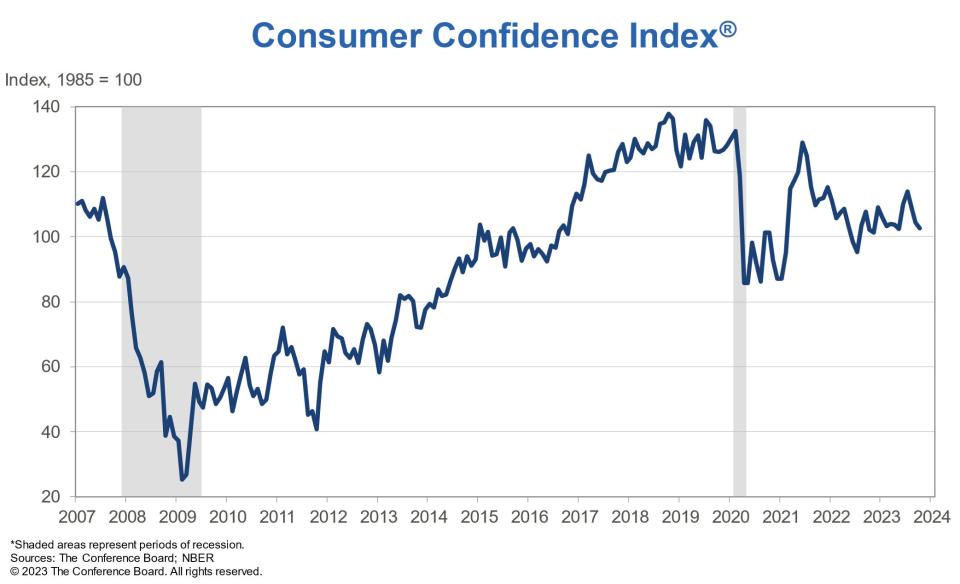
3. Consumer confidence has fallen three months in a row
Consumer confidence slipped further in October to a reading of 102.6Conference Board
Consumer confidence slipped to 102.6 in October, down from a reading of 104.3 the prior month, according to the Conference Board. That marks the third month in a row that consumers’ attitudes have soured, based on factors like inflation, stock prices, and interest rates.
Meanwhile, the Conference Board’s Expectations Index, which reflects consumers’ short-term economic outlooks, slipped to 75.6 in October. It remains slightly below a key threshold of 80, which has traditionally signaled a recession coming within the next 12 months.
“Consumer fears of an impending recession remain elevated, consistent with the short and shallow economic contraction we anticipate for the first half of 2024,” the Conference Board said in a statement.
4. Consumers aren’t planning to splurge this holiday season
Americans are less likely to splurge this holiday season than last year.McKinsey & Company
Americans are looking less likely to splurge, even as they head into the holiday season. A McKinsey survey of 1,000 US consumers found that just 35% say they plan to spend big this year, lower than the 39% of people who said they were willing to splurge ahead of the holidays in 2022.
A separate Morgan Stanley survey found that 69% of people are waiting for retailers to offer discounts before they start shopping. On average, consumers are looking for a discount of around 30%, strategists said.
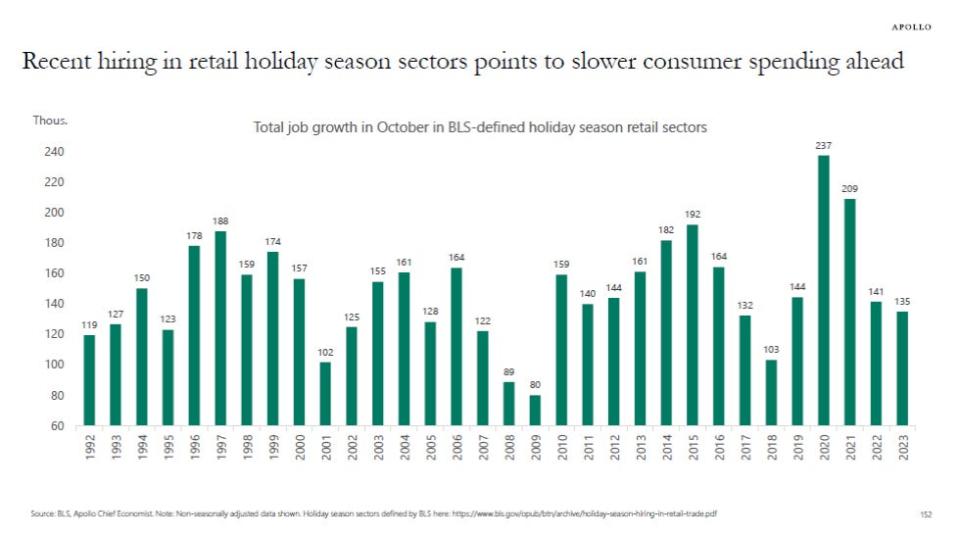
5. Retailers aren’t hiring as much ahead of the holidays
Holiday hiring slumped to the lowest level in five years.Apollo/Bureau of Labor Statistics
Holiday hiring among retailers slumped to 135,000, the lowest level in about five years, according to data from the Bureau of Labor Statistics.
“Hiring for the holiday season is generally done in October, and adding up new jobs created in the BLS-defined holiday season retail sectors in the latest employment report shows that retailers expect a weaker holiday season,” Apollo chief economist Torsten Slok said in a note on Tuesday.
BNB price avoided a major decline below $200 and recovered against the US Dollar. It climbed above $235 and now faces many hurdles near $245 and $250.
BNB price is slowly moving higher toward the $250 resistance.
The price is now trading above $235 and the 100 simple moving average (4 hours).
There is a key bullish trend line forming with support at $241.5 on the 4-hour chart of the BNB/USD pair (data source from Binance).
The pair might gain bullish momentum if there is a clear move above $250.
BNB Price Recovers 10%
These past few days, BNB price managed to start a recovery wave above the $220 resistance. The recent positive moves in Bitcoin, Ethereum, and other altcoins sparked a decent increase in BNB.
There was a steady move above the $232 and $235 resistance levels. The price even climbed toward the $245 resistance. A high is formed near $245.8 and the price is now consolidating gains. It is trading above the 23.6% Fib retracement level of the upward move from the $222.5 swing low to the $245.8 high.
BNB is also trading above $235 and the 100 simple moving average (4 hours). Besides, there is a key bullish trend line forming with support at $241.5 on the 4-hour chart of the BNB/USD pair.
If there is a fresh increase, the price could face resistance near the $245 level. The next resistance sits near the $250 level. A clear move above the $250 zone could send the price further higher. In the stated case, BNB price could test $265. A close above the $265 resistance might set the pace for a larger increase toward the $280 resistance.
Downside Correction?
If BNB fails to clear the $245 resistance, it could start a downside correction. Initial support on the downside is near the $240 level and the trend line.
The next major support is near the $235 level or 50% Fib retracement level of the upward move from the $222.5 swing low to the $245.8 high. If there is a downside break below the $235 support, the price could drop toward the $226 support. Any more losses could initiate a larger decline toward the $220 level.
Technical Indicators
4-Hours MACD – The MACD for BNB/USD is losing pace in the bullish zone.
4-Hours RSI (Relative Strength Index) – The RSI for BNB/USD is currently above the 50 level.
The Federal Reserve’s preferred inflation metric showed prices over the prior month jumped by the most since May while annual price increases continued to cool in September, sharpening the prospects for the central bank to keep interest rates “higher for longer.”
“Core” Personal Consumption Expenditures (PCE) Index, which excludes the volatile food and energy categories, showed prices rose 0.3% in September and 3.7% from the prior year, data released by the Commerce Department on Thursday showed. The 0.3% increase in core PCE was driven by categories like cars, prescription drugs, and travel.
On a headline basis, which includes all categories, PCE rose 3.4% over last year and 0.4% month-over-month. September’s annual rise in “core” PCE was the smallest since May 2021 and marks the third-straight month prices have increased at a slower annual rate.
Core PCE is the inflation measurement preferred by the Fed, as PCE — unlike the more widely cited Consumer Price Index (CPI) — feeds directly into GDP. The Fed targets 2% annual inflation.
The core PCE figure “reflects the stickiness of core services inflation, which is still too strong to be consistent with inflation falling back to the Fed’s 2% target,” Oxford Economics lead economist Michael Pearce wrote in reaction to the data.
In a note to clients on Friday, Ian Shepherdson, chief economist at Pantheon Macroeconomics, said this data is, “not yet good enough for the Fed to declare victory, so next week’s FOMC meeting will bring more of the same message: The fall in inflation is welcome but not yet definitive.”
The Fed is expected to keep rates unchanged in a range of 5.25%-5.50% at the conclusion of its two-day policy meeting on Nov. 1.
Personal spending increased 0.7%, outweighing personal income, which rose 0.3%.
“Disposable income growth has come under pressure as wage and job growth slows,” Pearce said. “The weakness also reflects a slight fiscal tightening as transfer payments decline and as tax payments increase.”
“With incomes falling, higher spending is being funded by lower saving, with the personal saving rate declining to 3.4% in September, its lowest since December 2022,” the economist continued.
“While we estimate there is still a considerable stock of excess saving left over from the pandemic, that is now mostly concentrated among higher income households and appears to be increasingly treated as wealth, so we expect the boost to spending from lower saving to wane from here. We also expect some increase in precautionary saving as the job market slows.”
The price of goods edged up 0.9% in September from a year ago, higher than August’s 0.7% rise. Durable goods fell another 2.3% after falling 1.9% in August while non-durable goods ticked up 2.7%.
Services saw prices rise by 4.7% — below August’s 4.9% increase. Food prices also came in lower compared to the prior month, with September’s reading showing a 2.7% yearly rise compared to a 3.1% jump in August.
Energy goods and services were flat in September after falling 3.6% in August.
Federal Reserve Chairman Jerome Powell. Core PCE is the inflation measurement preferred by the Fed (AP Photo/Seth Wenig, file)
Government data released on Thursday showed the US economy grew at its fastest pace in nearly two years during the past three months as consumers stepped up their spending despite a high interest rate environment.
The hot GDP print comes as inflation has remained significantly above the Federal Reserve’s 2% target. A labor market that, while softening in certain areas, is still tight, suggests the Federal Reserve could continue to raise interest rates. The Federal Reserve’s latest meeting minutes showed policymakers support a more restrictive rate environment.
Read more: What the Fed rate-hike pause means for bank accounts, CDs, loans, and credit cards
Cleveland Fed president Loretta Mester said last week she still sees the possibility of one more rate hike this year.
But markets still expect the central bank to keep rates steady at its meeting later this month. Following the release of the data, markets were pricing in a roughly 99% chance that the Federal Reserve keeps rates unchanged at its upcoming policy meeting, according to data from the CME Group.
Alexandra Canal is a Senior Reporter at Yahoo Finance. Follow her on Twitter @allie_canal, LinkedIn, and email her at alexandra.canal@yahoofinance.com.
Click here for the latest economic news and indicators to help inform your investing decisions.
Read the latest financial and business news from Yahoo Finance
Retirement is an exciting milestone in life, but if you retire before you’re financially ready, it could spell trouble down the road.
It can be tough to know when you’re ready to retire, as everyone will have slightly different situations and goals. But if you’re thinking about retiring in 2024, there are three signs it may be the right time.
1. You’ve met your savings goal
There’s no hard-and-fast rule as to how much you should save for retirement. Many people strive for $1 million, but some may need far more or even less than that to live comfortably.
Image source: Getty Images.
It’s best, then, to calculate your goals based on your unique situation. One general rule of thumb is to have enough savings to replace around 80% of your pre-retirement income.
You could need more or less than this figure, though, depending on your situation. If you plan to travel extensively or pick up pricey new hobbies, for example, you may need more than 80% of your pre-retirement income. On the other hand, if you plan to cut costs drastically or move to a city with a much lower cost of living, you may not need as much.
Regardless of your specific goals, it’s important to have thought about how much savings you’ll need before you retire. It’s far easier to save more now than to go back to work later if you run out of money.
2. You know how much to expect from Social Security
Most retirees are entitled to Social Security benefits. While they likely won’t be enough to cover all of your costs in retirement, they can go a long way.
If you haven’t already done so, now is the time to check your estimated benefit amount. You’ll need to view your statements — which you can do by creating a mySocialSecurity account online. From there, you can see an estimate of your future benefit amount based on your real earnings.
Keep in mind that this number assumes you’ll be filing for benefits at your full retirement age — which is age 67 for anyone born in 1960 or later. If you plan to begin claiming before or after your full retirement age, it will affect your benefit amount.
Once you know how much to expect from Social Security, it will be easier to tell whether your personal savings will be enough. If you find that they’re falling short, it’s better to know that now while you still have some time to save.
3. You have a plan for healthcare costs
Healthcare costs can be extraordinary in retirement. In fact, the average 65-year-old couple retiring in 2023 can expect to spend around $315,000 on out-of-pocket healthcare expenses throughout retirement, according to research from Fidelity Investments.
Medicare can help cover some of those costs, but it may not cover everything — including routine exams, dental care, and prescription eyeglasses. It also generally doesn’t cover long-term care (such as nursing home care), which can cost tens of thousands of dollars per year.
It can be tough to budget for healthcare expenses, as it’s impossible to say exactly how much you’ll spend. But taking steps like signing up for long-term care insurance, comparing different Medicare Advantage plans, or simply building healthcare costs into your budget can help you better prepare.
Retirement planning isn’t always easy, but the more thorough you are now, the better off you’ll be later. If you’ve already covered these three steps, that may be a sign you’re ready to head into the next chapter of your life.
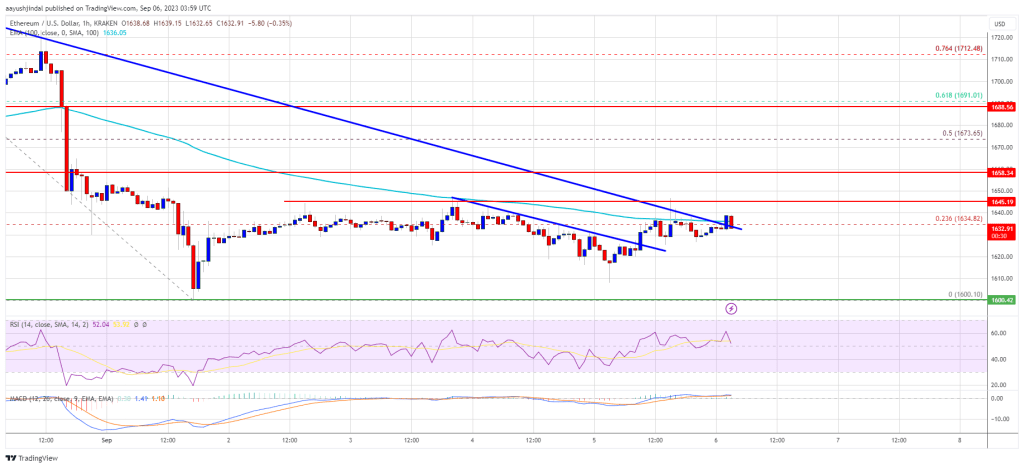
Ethereum price is attempting a recovery wave above $1,620 against the US Dollar. ETH must settle above $1,650 to start a decent increase.
Ethereum is slowly moving higher from the $1,600 support zone.
The price is trading near $1,630 and the 100-hourly Simple Moving Average.
There was a break above two bearish trend lines with resistance near $1,620 and $1,630 on the hourly chart of ETH/USD (data feed via Kraken).
The pair could start a steady increase if there is a close above the $1,650 resistance.
Ethereum Price Holds Key Support
Ethereum’s price managed to stay above the $1,600 support zone. ETH price is forming a base and is currently attempting a recovery wave above $1,620, like Bitcoin.
There was a break above two bearish trend lines with resistance near $1,620 and $1,630 on the hourly chart of ETH/USD. The pair retested the 23.6% Fib retracement level of the main decline from the $1,750 swing high to the $1,600 low.
Ether is now trading near $1,630 and the 100-hourly Simple Moving Average. On the upside, the price might face resistance near the $1,645 level. The next resistance is near the $1,660 level, above which the price could rise toward the $1,675 level.
The 50% Fib retracement level of the main decline from the $1,750 swing high to the $1,600 low is also near $1,675. The next major barrier is near the $1,700 level. A close above the $1,700 level might push Ethereum into a positive zone. The next resistance might be near $1,750. Any more gains might send the price toward the $1,800 resistance.
Another Decline in ETH?
If Ethereum fails to clear the $1,660 resistance, it could start another decline. Initial support on the downside is near the $1,620 level. The first key support is close to $1,600. A downside break below $1,600 might increase selling pressure.
The next major support is near the $1,580 level. If there is a downside break below $1,580, the price could revisit the key $1,540 support level. Any more losses might send the price toward the $1,480 level or even $1,440.
Technical Indicators
Hourly MACD – The MACD for ETH/USD is slowly gaining momentum in the bullish zone.
Hourly RSI – The RSI for ETH/USD is now above the 50 level.
Are you less happy at work since you befriended that new recruit? Have they told you stories about how colleagues have constantly undermined them? Maybe you have a boss who excludes you from key meetings and then asks why you did not attend a meeting even though you are pretty sure you were not invited to begin with. If any of this rings true, you may be working with a gaslighter.
Gaslighters, as the name suggests, cast themselves in a positive light — friend or confidante who is here to help — but actually are manipulating or undermining others, usually from the shadows, which adds to their potential power.
Merriam-Webster named “gaslighting” the word of the year. Searches for the word on Merriam-Webster.com surged 1,740% in 2022 over the prior year, despite there not being an event that the publisher — known for its dictionaries — could point to as a cause of the spike.
It defines gaslighting as “psychological manipulation of a person usually over an extended period of time that causes the victim to question the validity of their own thoughts, perception of reality, or memories and typically leads to confusion, loss of confidence and self-esteem, uncertainty of one’s emotional or mental stability, and a dependency on the perpetrator.”
The term was coined in a 1938 play, “Gas Light,” a psychological thriller set in Victorian London and written by Patrick Hamilton.
George Cukor’s 1944 film, “Gaslight,” based on the play, further popularized the term. In that film, Gregory (Charles Boyer) tries to convince his wife Paula (Ingrid Bergman) that she has lost her reason. When he turns on the lights in the attic in his search for a treasure trove of hidden jewels, the gaslight flickers in the rest of the house. He tells Paula that she is merely imagining the dimming of the lights.
‘Jerks at work’ or actual gaslighters?
The workplace is fertile ground for such behavior, given what’s at stake: money, power, status, promotion, rivalry and the intrigue that often comes with office politics.
I’m in the business of helping people work out their conflicts at work. In fact, I dedicated a whole chapter in my book, “Jerks at Work,” to gaslighters.
“‘For gaslighters, slow and steady wins the race, and the best ones make friends with their victims first.’”
What has surprised me is how wide-ranging the definition of “gaslighting” has become. Everything from “not respecting personal boundaries” to “talking so much shit about me I couldn’t get hired for two years” seems to fall under the “gaslighting” umbrella.
What I’ve learned from my doom scrolling on social media is that the word “gaslighter” — probably the worst name to bestow on a colleague or boss — seems to refer to anyone who’s done a whole bunch of bad things to us at work, especially things that involve humiliation.
So what really is a gaslighter, and why is it important to distinguish one from, say, a demeaning boss with a chip on their shoulder and a penchant for public shaming?
If we stick to the clinical definition, gaslighters have two signature moves: They lie with the intent of creating a false reality, and they cut off their victims socially.
They position themselves as both savior and underminer, creating a negative and fearful atmosphere, spreading gossip and taking credit for other people’s work. They are often jealous and resentful, and aim to undercut others in order to further their own position.
“ In the workplace, you may also be an unwitting pawn in the gaslighting of another colleague. ”
You may also be an unwitting pawn in the gaslighting of another colleague. The gaslighter might try to convince you that Johnny is trying to steal your leadership role on a project, and encourage you to freeze him out in the cafeteria at lunch time, or simply be extra wary about sharing important information.
For gaslighters, slow and steady wins the race, and the best ones make friends with their victims first. For this reason, it could also be considered a form of workplace harassment.
They often flatter them, make them feel special. Others create a fear of speaking up in their victims by making their position at work seem more precarious than it is. And the lies are complex, coming at you in layers. It takes a long time to realize your status as a victim of gaslighting, and social isolation is a necessary part of this process.
“‘It takes a long time to realize your status as a victim of gaslighting, and social isolation is a necessary part of this process.’”
Take smart action — no direct confrontration
There’s a difference between an annoying coworker or micromanaging boss, and a gaslighter, who lies and conspires to undermine your position. “The gaslighter doesn’t want you to improve or succeed — they’re out to sabotage you,” according to the careers website Monster.com. “They will accuse you of being confused or mistaken, or that you took something they said the wrong way because you are insecure. They might even manipulate paper trails to “prove” they are right.”
Examples cited by Monster.com: “You know you turned in a project, but the gaslighter insists you never gave it to them. You can tell someone has been in your space, moving things around, or even on your computer, but you don’t have proof. You are the only one not included in a team email or meeting invite, or intentionally kept out of the loop. Then when you don’t respond or show up, you are reprimanded.”
Knowing this, what can you do to prevent yourself from becoming a target? First, recognize that gaslighters don’t wear their strategy on their sleeve. Flattery, making you feel like you’re a part of a special club, or questioning your expertise are not things that raise gaslighting alarm bells.
Rather than looking out for mean behavior by a boss or coworker, look out for signs of social isolation. A boss who wants to cut you off from coworkers and other leaders should raise red flags, even if the reason is that “you’re better than them.”
Second, recognize that lie detection is a precarious — and from a scientific perspective, almost impossible — business. Don’t try to become a lie detector, instead take notes, so you can put your “gaslighter” on notice that you are wise to their tactics. You can also use the notes as evidence if you decide to later raise the situation with your human resources department.
Here are some ways to beat the gaslighter: Send emails with “a summary of today’s meeting” so you can document the origin of ideas and make sure they don’t steal credit from you. Furthermore, document things that happened in person, and share it with your would-be gaslighter. And speak up at meetings. Don’t allow yourself to be browbeaten into submission.
The more you document, the more difficult it will be to be victimized. But a word of warning: Don’t try to confront gaslighters — instead, go to your social network to build your reality back up. Trying to beat these folks at their own game is a losing strategy.
Any of these actions, and especially a combination done early in a professional relationship, can work wonders protecting yourself and your career.
‘We’re like rats in a cage’: Sick and tired of their jobs, American workers strive to regain their agency, their time — and their sanity‘
People are seeking a genuine connection with their colleagues’ — one that goes beyond ‘Hollywood Squares’ Zoom meetings. Not all workers are happy with remote work.‘
The backlash to quiet quitting smacks of another attempt by the ruling class to get workers back under their thumbs:’ Am I wrong?
We want to hear from readers who have stories to share about the effects of increasing costs and a changing economy. If you’d like to share your experience, write to readerstories@marketwatch.com. Please include your name and the best way to reach you. A reporter may be in touch.
After a decent, though uneven, run for stocks since January, the stock market forecast for the next six months remains mildly bullish. Big gains in tech stocks, from giant Microsoft (MSFT) and enterprise database software turnaround play Oracle (ORCL) to Palantir Technologies (PLTR), a favorite among individual investors and relatively new issue, have excited investors.
X
Judging by this past month’s action in the stock market, indeed it appears the animal spirits have returned. Gains have accelerated in the past two months, especially so across the broader market in June and into early July.
Beyond top tech stocks, strong moves by consumer growth companies, such as energy-drink maker Celsius (CELH), transportation innovator Uber (UBER) and midcap cosmetics marketer ELF Beauty (ELF) — up as much as 260% from a July 2022 breakout past a cup with handle and a 33.44 buy point — have added quality leadership to the market.
But the sanguine outlook could darken quickly if investor expectations for corporate earnings, interest rates and stability of the banking industry take a turn for the worse.
In fact, the week ended July 7 saw both stocks and U.S. Treasury bonds fall together in price. With expectations of a new quarter-point rise in the fed funds rate by the Federal Reserve recently rising to nearly full tilt, according to calculations by the CME’s FedWatch survey of futures activity, the yield on the benchmark 10-year Treasury bond jumped to as high as 4.09% on July 7.
The yield has since plunged to as low as 3.73% in recent days. Three months ago, the 10-year yield squatted near 3.25%.
And the risks don’t end at U.S. borders. A diplomatic or military event, such as an escalation of the Ukraine-Russia war, could chill investors’ mood.
IBD Big Picture: Will Palantir Technologies Form This Rare Chart Pattern?
The Federal Reserve is likely not done raising the cost of money to tame inflation. So, interest rates may remain top of mind for investors. Even after recent encouraging data showing inflation cooled further in May, Wall Street still eyes the possibility the U.S. central bank could raise short-term interest rates by half a point in total in the second half of the year.
Nonetheless, market veterans see a touch of gains in stock prices ahead.
Stock Market Forecast For S&P 500 At Year’s End
The S&P 500 finished strong during the final week of June, rising nearly 2.4%. It more than recouped the prior week’s 1.4% decline. At 4450, the large-cap benchmark etched its highest weekly close since the week ended April 8, 2022. This past week, the 500 added another 0.6% and reached 4578. It hit levels not seen since April 2022.
Earlier in June, the S&P 500 had already barreled past many Wall Street firms’ forecasts that it would hit 4200 to 4300 by year’s end.
Veteran market observer and economic forecaster BCA Research, in an early-June report titled “So Far, So Good On The Road To 4500,” feels “vindicated” that the large-cap stock index at one point pulled to within 2% of its 2023 year-end forecast. But its optimism for the second half of the year? Clearly bridled.
“We remain tactically overweight equities but are preparing to transition to equal weight once the S&P 500 reaches 4500,” the research firm wrote June 18. “Although the index may well peak above our target, we do not expect the rally will last beyond the summer.”
One reason? BCA thinks Wall Street’s forecasts for stocks will “become too buoyant” but “negative surprises will ensue” on the corporate earnings front. BCA also predicts an economic recession will arrive in the first half of 2024.
First Half 2023 Vs. First Half 2003
Howard Rosenblatt at S&P Global Intelligence noted that in 2003, the top 10 stocks accounted for 30.4% of the total return in the S&P 500 during the first six months of that year. They included General Electric (GE), Citigroup (C), Pfizer (PFE), Cisco Systems (CSCO) and Amgen (AMGN).
So, how about in 2023? The top 10 firms accounted for 37.4% of the total gains in the first half of this year. Just three of the 10 came from outside tech: Berkshire Hathaway (BRKB), which does have tech stocks in its investment portfolio, Eli Lilly (LLY) and JPMorgan Chase (JPM).
Stock Market Today
Meanwhile, the tech-fortified Nasdaq composite finished the last week of June and the quarter on a strong note.
At 13,787 on June 30, its 2.2% weekly gain eclipsed the prior week’s reasonable loss of 1.4%. The Nasdaq finished the second quarter with a 12.8% jump. It’s pole-vaulted 31.7% during the first six months of 2023.
On Friday, during the first heavy week of earnings results for the second quarter, the Nasdaq made fresh 52-week highs before cooling off. The composite index closed down 0.6% for the week at 14,032..
Small caps are still lagging, but are doing better lately. The Russell 2000 advanced almost 8% in June alone to 1888. A weekly chart also revealed technical buying support for the Russell small-cap gauge during last week’s pullback. Bullish action. Small and medium lenders, which make up a big chunk of the Russell 2000, have rebounded amid positive news on the Federal Reserve’s stress tests on the nation’s biggest lenders.
The Russell 2000, trading at 1960, now holds an 11% gain year to date. Yet it still trades 20% below its November 2021 all-time peak of 2458.
Big Picture: Stock Market Win Streak Ends, But These Stocks Shine
Corporate Earnings, Inflation, Interest Rates
Hard-core pessimists among those giving a concrete stock market forecast for the next six months include Mike Wilson, chief U.S. equity strategist at Morgan Stanley. As of June 5, he predicted the S&P 500 will slump to 3900 by year’s end, the Wall Street Journal reported. Why? He sticks with the thesis that S&P 500 corporate earnings could drop 16% this year to a cumulative $185. The FactSet consensus? Growth of nearly 2%.
Apply a price-to-earnings ratio of 20 times Wilson’s earnings estimate and you’ll get a dour 3700 target by the end of December.
This would mean the S&P 500 would have to fall more than 15% from here. Such a drop would qualify as an intermediate-level correction.
Inflation and interest rates loom large in the outlook. The Fed decided at its June 13-14 meeting not to raise the fed funds rate from a 5%-5.25% target range. But central banks in Canada and Australia, plus the European Central Bank, recently decided to keep rate hikes going. In testimony to Congress this past week, Fed chief Jerome Powell signaled more monetary tightening in the U.S. is in the pipeline.
2 More Rate Hikes To Go In 2023?
CME FedWatch currently calls for a 99% chance the Fed will lift the fed funds rate by another quarter-point to a range of 5.25%-5.5% at its July 25-26 meeting.
The rise may be attributed to comments made by Powell at an ECB forum in Portugal earlier this month. The Fed chief reiterated concerns that the inflation rate has not fallen to the central bank’s long-term target. He hinted that perhaps additional interest rate hikes are needed to achieve the goal of low-inflation economic growth.
A June U.S. jobs report indicated the labor market is still quite tight and nonfarm payrolls continue to grow. However, recent data on June consumer prices eased concerns that the U.S. central bank will hike rates further after July.
Stronger than expected Q1 GDP growth of 2%, released in early July, has now boosted somewhat the chance of an additional quarter-point hike in the fourth quarter of this year. That would raise the fed funds rate to a range of 5.5%-5.75%.
Meanwhile, new U.K. inflation figures showed a higher-than-expected 8.7% year-over-year jump for May consumer prices. Month over month, inflation rose 0.6%. The figures hinted that monetary tightening across the world may continue. That’s bearish news for the stock market forecast. But in June, U.K. inflation cooled.
U.S. stock market gains in the first half of 2023 have been rosier than some entire years in the past. This alone raises the risk for a spill in prices.
The S&P 500’s rise in 2023 reached almost 16% in mid-June. That surpassed full-year gains in 2010 (up 15.1%), 2011 (2.1%), 2014 (13.7%), 2015 (1.4%) and 2016 (12%).
The gains have been concentrated, though.
Consider Palantir, which has carved a niche in AI-applied data analytics for both the government and private sectors for years. PLTR stock had soared as much as 167% since Jan. 1 before its current pullback near 14.
Due not only to its mini-rocket-like move since clearing resistance at 10 but also to two quarters in a row of solid top- and bottom-line growth — earnings up 100% and 150% in Q4 2022 and Q1 2023, respectively, on revenue gains of 17% and 18% — Palantir has achieved a top-flight 99 Composite Rating.
Despite a sharp sell-off last week, PLTR is still trading head and shoulders above its fast-climbing 10-week moving average. The current action also appears to resemble a potential high, tight flag, one of the rarest chart patterns among big stock market winners.
Leading The Magnificent Seven
Among other tech stocks, Microsoft (97 Composite Rating, 90 Earnings Per Share Rating and 90 Relative Strength) has garnered oodles of attention and investor dollars amid the rush to develop new products, services and platforms that leverage artificial intelligence.
The megacap tech stock has rallied as much as 46% in 2023 and has powered 165% higher since its 2020 pandemic bear-market low near 132.
IBD Stock Of The Day
Another View Of The S&P 500’s Performance
What if we remove the market’s upward bias produced by big tech stocks? The Invesco S&P 500 Equal Weight (RSP) exchange traded fund was up as much as 10% at its Feb. 2 peak this year. Yet last week, those gains shriveled to less than 3%. On Tuesday, RSP rallied 1.2%.
In contrast to the highflying tech stocks, small caps still have not excelled since the January rebound.
Just take a look at iShares Russell 2000 (IWM). Despite rising a fifth session in a row on June 30, the exchange traded fund at that point still showed a modest 7.3% gain for the year. The S&P MidCap 400 (type in zero-SPMC on an Investors.com chart), at 2622 the same day, was up almost 8% from its Jan. 1 start at 2430.
Meanwhile, 2023 has not ushered in a bull market at all for commodities so far.
In 2021, oil and gas stocks and metal miners helped boost the equity indexes. That’s not the case today. Of course, this has implications for the overall breadth of the stock market’s advance.
West Texas Intermediate crude oil futures remain in a bear market. On the NYMEX two weeks ago, crude traded at $70.45 a barrel, 46% below its March 2022 peak of $130.50. On Friday, following a sharp rebound, WTI crude rallied to as high as $73.92 a barrel.
Gold futures, which edged lower at the end of June to $1,919 an ounce, have likely disappointed traders with a 5.3% gain year to date. Gold closed Friday at $1,932 an ounce. Copper lies more than 23% below a March 4, 2022, peak of $4.93 per pound.
Yet for the courageous investor who seeks to carve out gains by picking individual stocks, the stock market forecast for the rest of 2023 appears bullish. In fact, quite bullish.
The median gain this year through June 22 within the IBD 50 list of top growth stocks? A whopping 48%. At least five companies, including semiconductor equipment firm Axcelis Technologies (ACLS), Leaderboard half-size positionDraftKings (DKNG), IoT play Samsara (IOT) and small-cap Symbotic (SYM) have vaulted 100% or more.
Even some old leaders of the dot-com bubble in tech stocks have shown some mojo. Oracle (94 Composite Rating, 87 EPS Rating, 95 Relative Strength Rating) has rallied as much as 40% after clearing a large cup with handle at 91.22.
Oracle has focused on developing new and better products that help corporate customers utilize cloud-computing technology with the help of artificial intelligence.
Since the generative AI tool ChatGPT arrived late last year, artificial intelligence has become the buzzword among companies and investors, driving many tech stocks. But some question the substance behind the fanfare.
“Is recent equity market performance just AI-generated?” one large mutual fund firm noted sarcastically in the subject line of its weekly commentary.
Any stock market forecast for the next six months should take into account the likelihood that rallies get overdone and sell-offs go too far. Certainly, market booms always carry some amount of investor hype. A recent FactSet study found that conference calls on first quarter results by S&P 500 firms showed a spike in the use of the term “AI” and a sharp decline in the use of “ESG,” which stands for environmental, social and governance factors.
The bulls, however, still have good reasons to maintain a positive stock market forecast. Why? A Wall Street Journal front-page piece in the spring painted the market conditions as if it were describing a “Waiting For Godot” recession. Put another way, will the much-anticipated recession even arrive?
From that point of view, it’s hard for the bears to dispute the reasons for the market’s progress this year. A positive stock market forecast reflects brighter prospects for the greater economy.
“My favorite economist, Ed Yardeni, has changed his tone and is now calling the current environment a ‘rolling recovery,’ which is better than his previous comment that we were in a ‘rolling recession,’ ” Louis Navellier, veteran mutual fund manager, said in a recent comment to clients.
AI Stocks Today: What To Buy And Watch Now
S&P 500 Earnings Forecasts
Trading near 4417 on Friday, the S&P 500 trades at 20 times the consensus earnings estimate of $220.44 this year (based on June 20 data) and 17.9 times the 2024 profit forecast of $246.38, according to Yardeni.com. Those figures point to a modest 1.1% increase in earnings for blue chip companies this year and an acceleration to 11.8% growth in 2024.
As of June 20, Yardeni Research saw another 11% gain in earnings to $274.44 in 2025.
Strategists like to compare the earnings yield for large-cap companies — the expected earnings divided by the S&P 500 price, multiplied by 100 — with the bond market. What do we see? An expected earnings yield for the S&P 500 of 5%, based on the 2023 profit forecast. That compares favorably with the generally accepted risk-free return of 3.76% for 10-year U.S. Treasury bonds.
Corporate profits make up a large part of the equation for future investment returns. Clearly, this stock market rally is banking on a profit turnaround that has not happened yet.
According to research from FactSet, analysts predict a 6.4% decline in earnings for S&P 500 firms in the second quarter vs. a year earlier. If the forecast is accurate, it would spell the largest drop in profits since a 31.6% plunge during the second quarter of 2020, near the onset of the Covid-19 pandemic.
S&P 500 Earnings By Sector
As of June 9, 66 of the S&P 500 companies had issued weaker-than-expected guidance on Q2 earnings. That runs below the long-term average. Another 44 S&P 500 firms have issued positive EPS guidance.
But Wall Street may be expecting some sunshine during the back half of the year. Analysts surveyed see earnings rising 0.8% in the third quarter year over year, then accelerating to an 8.2% rise in Q4.
FactSet also reported on June 9 that the price-earnings ratio for the S&P 500 is 18.5 times forward 12-month earnings. That creeps just below the 5-year average of 18.6. But it stands higher than the 10-year average of 17.3.
The reason? FactSet notes that nine of the S&P’s 11 sectors likely will report year-over-year earnings growth, and five of these nine sectors could post double-digit gains. They include communication services (36.3%), utilities (26.2%), consumer discretionary (21.3%), information technology (12.4%) and financials (11.2%).
“The expected top contributors to earnings growth for the S&P 500 for Q4 2023 have all seen significant price increases since the start of the year,” FactSet wrote.
Meanwhile, the near-term profit picture for energy stocks still looks dreadful. The sector could report a 24.1% fall in earnings for the fourth quarter. A 1.7% dip is expected for materials companies.
Where Is The Stock Market Headed? Read This Column Each Day
Homebuilding’s Place In The Stock Market Forecast For The Next Six Months
Good markets need good leadership. While many might think tech stocks were the main driver in exiting the 2022 bear market, one should not ignore the strength of homebuilding stocks.
The residential and commercial building stock group, one of 197 industries tracked by IBD, has jumped as much as 35% on a price-weighted basis since Jan. 1. That even beats the Nasdaq’s market-leading advance.
One of the group’s leaders, Meritage Homes (MTH), has bolted more than 40% since the midcap stock cleared a 97.01 buy point from a large cup-with-handle base. On Tuesday, Meritage Homes shares gained 3.3% and hit a new high of 140.55.
These stocks’ strength underscores a rebound in housing starts and hints that the market in new home sales has bottomed.
Building Ranks No. 3 In IBD’s Stock Tables: See The Top 5 Sectors Here
Cooling Home Prices Benefit Inflation Data, Stocks
Bill Adams, chief economist at Comerica Bank, noted that the recent data on new home sales was “mixed news for homebuilders, but good news for the inflation outlook.”
Adams believes homebuilders “are moving to lower price points to keep sales going.” The reasons range from more expensive financing to a decrease in materials costs. And a cooling of prices in the housing market bodes well for inflation in general. Lower inflation benefits stocks prices, for it eases pressure on the Federal Reserve to continue ratcheting up interest rates.
“New home prices don’t directly go into the consumer price basket, but they do influence average shelter costs after a lag of a few quarters. So April’s drop in new home prices is good news for core inflation. The median price of an existing home also fell in year-over-year terms in April, although by less — just 1.7%,” Adams added.
As of Friday’s finish, IBD’s Building sector ranked No. 3 among 33 sectors in terms of mid- and long-term performance. Building also advanced 32.8% since Jan. 1, the fourth best gain following Chips at No. 1 (up 43.8% year to date), Internet at No. 8 (38.1%) and Computer at No. 1 (35%).
William O’Neil, Legendary Investor And IBD Founder, Dies At 90
U.S. Presidential Cycle
As is often the case in the third year of a U.S. presidential cycle, stocks have a yen for rising. However, 2022’s performance and the evolution of the digital economy seem to also play a role in this year’s gains.
The Nasdaq has surprised bearish traders with a rise since Jan. 1 that at one point topped 30%. The rally follows the Nasdaq’s 33% drop in 2022. Bargain hunters have crowded into stocks. Lower valuations have given the stock market forecast more wind in its sails.
Indeed, the bear market of November 2021 through October 2022 removed a great deal of speculative froth from tech stocks and other premium-priced equities.
Meanwhile, the U.S. economy, which has gotten more and more digital over the past three decades, stands to continue in that direction.
Uneven 2023 Performance For Major Stock Indexes
The Dow Jones Industrial Average and the S&P 500 have clearly underperformed the Nasdaq. Poor action among bank stocks is the main albatross hanging from the necks of these two benchmarks. Two superregional lenders, SVB Financial and Signature Bank of New York, went belly-up in March because they could not handle a mass exodus of client funds.
During that March panic, the Nasdaq fell 10.5% in less than six weeks and briefly undercut its 200-day moving average.
Since then, bank stocks have continued to sharply underperform.
As of Friday’s close, the S&P 500 rallied as much as 8.4% in the second quarter of this year. But the exchange traded fund SPDR S&P Regional Banking (KRE) at one point slid more than 8%.
At its May 4 low, KRE cratered 41% for the year. The ETF finished Q2 at 40.83, down 7% and off 30.5% since Jan. 1.
The Key To Big Investor Gains? Fewer Stocks, Not More
Is The 2023 Banking Crisis Over?
Investors should stay alert to banking news. Bank stocks continued to nose-dive in April and May, even though the U.S. government provided a guarantee of deposits that exceeded the federal deposit insurance limit of $250,000.
Then the Fed continued to raise the cost of money in the spring with more interest rate hikes. Banks plummeted further.
More news of shaky liquidity among lenders both big and small would severely dent the stock market forecast for the next six months.
A Sign of Banker Confidence?
Yung-Yu Ma, chief investment strategist at BMO Wealth Management, noted in recent commentary that investors still worry that regional banks may have to sell commercial real estate to remain solvent and preserve shareholder confidence. But he’s seen anecdotal evidence that banking executives are buying their companies’ shares.
“It could mean that those insiders feel positive about the trajectory of their business. So, overall, that’s helped the rally to broaden out and small caps to do well,” Ma wrote.
Yet Frank Zhao, senior director at S&P Global Market Intelligence, thinks the challenges facing certain banks have just started.
“Ominous clouds are on the horizon as banks’ commercial loan portfolios come under scrutiny,” Zhao wrote in a comment sent to IBD. “Vacancy rates for office buildings have hit all-time highs. For the first time in the past five (earnings) seasons, banks are prominently discussing their exposures to the commercial real estate market.”
Still, this crisis hasn’t stopped the U.S. from promoting a hawkish monetary policy.
U.S. financial history is riddled with waves of bank closures due to a persistent rise in lending rates and tightening business regulations. Thus, investors would do well to remember the wisdom of Jorge Agustin Nicolas Ruiz de Santayana y Borras, better known in English-language circles as George Santayana: Those who cannot remember the past are condemned to repeat it.
Stock Market Forecast: Repeat Of Stagflation 1970s?
From the early 1970s through the early 1980s, the Federal Reserve was forced to tighten the money supply in two separate campaigns to get inflation under control.
The question today: Will the Fed repeat history?
Right now, stocks have rebounded firmly on evidence that inflation is coming down, after peaking at 8% year-over-year increases at the U.S. consumer price level during the summer last year. Consumer prices rose 4% year over year in May, the smallest 12-month increase since March 2021.
But some market strategists think even just a few more moves by the Fed to raise the cost of borrowing for the nation’s largest banks could lead to economic contraction and an abrupt end of the solid run in stocks.
“We believe some members of the Fed may not be willing to rest until the seemingly resilient job market weakens and (that) results in a recession,” Brent Schutte, chief investment officer of Northwestern Mutual Wealth Management, wrote in comments sent to IBD.
“While wage pressures have retreated in recent months and wage expectations remain muted, the threat of a resurgence in wages that could … (force businesses to charge) ever-higher prices appears to continue to haunt some members of the Fed. As such, we continue to believe there is risk the Fed will overshoot to the upside on rates, and the economy will slip into a shallow, mild recession,” Schutte added.
Keep in mind that the fed funds rate has not yet reached the 6.5% level seen in May 2000, which led to the so-called “earnings recession” of the early 2000s. Since valuations in the stock market at the time had hit near-astronomical heights, the tighter monetary policy helped drive the Nasdaq into one of its worst bear markets.
From its then-peak of 5132 in March 2000, the composite index plunged 78% by October 2002.
More Caution On Stock Market Forecast For The Next Six Months
On Feb. 1 and March 22, the Federal Reserve continued to raise interest rates to bring down inflation. Already this year, the U.S. central bank has achieved success on that front. But on May 3, the Fed raised short-term rates by a quarter point for the third time this year. Many questions remain:
Has the Fed already raised rates too quickly, hurting the economy for months to come?
If the Fed keeps the fed funds rate at an elevated level for a long time, how will stocks behave?
How much will a slower economy hurt stocks?
In a recent piece titled “Long & Variable Lags,” economist Ed Yardeni of Yardeni Research pointed out this curiosity of 2023: “Tighter credit conditions after the banking crisis (seen in March) have not triggered a widespread credit crunch.”
Labor Market Is A Big Factor
Yardeni offers at least two reasons. “Consumers’ excess savings are dropping fast, but the economic effects are offset by retiring baby boomers’ massive net worth,” he wrote. Two, the strong labor market may create a lag in the effects of the Fed’s purse-tightening campaign that’s longer than usual, “but more muted this time.”
Liz Ann Sonders, chief investment strategist at Charles Schwab (SCHW), sounds a more cautious tone. She warns a collapse in the strong labor market could weigh heavily on equities.
Sonders noted on a CNBC interview this past week that aggregate savings have come down in recent years. Therefore, a spike in unemployment could unleash a negative cycle of lower overall spending, forcing companies to cut prices. Such actions hurt earnings, causing Wall Street to lower their assumptions on price-to-earnings multiples for the stock market. That action, in turn, sends stock prices falling.
Excessive Investor Optimism?
Another risk to watch? Some observers warn that investor giddiness could get to a level that triggers a sharp pullback in stocks.
Several indicators signal rising investor sentiment. But bullishness has not reached giddy heights, a time when no more future buyers exist. That’s usually when the stock market tops after a marvelous run.
Investors also should note that psychological market indicators come in and out of favor. Statistics that worked in the late 1990s and 2000s, such as the put-call volume ratio, seem to have lost their relevance today. The Cboe Market Volatility Index, or the VIX, has not pinpointed major stock market tops in recent years.
Nonetheless, the CNN Fear & Greed Index recently hit as high as 80, entering the zone of “Extreme Greed,” on a scale of 1 to 99.
Individual Investors Grow More Bullish
The American Association of Individual Investors’ weekly sentiment survey showed a big jump in bullishness for the week ended June 14. It rose to 45.2% vs. 29.1% on May 31. That compared with 32.1% among those polled who voted “neutral” (down slightly from the same time frame) and 22.7% (down from 36.8%) for “bearish.”
Meanwhile, the June 21 Investors Intelligence survey of market newsletters saw bulls move up to 54.3%, the highest point since November 2021. The market peaked at that time, when bulls reached a danger level of 57.2%. Bears have since dwindled to 20%, the fewest since January 2022.
Ed Clissold, chief U.S. strategist at Ned Davis Research, noted that the firm’s short-term NDR Daily Trading Sentiment Composite has reached its “excessive optimism zone” since June 1.
At the same time, the number of new IPOs as a percentage of NYSE stocks recently stood at 3.2%, near a five-year low. In other words, optimism among Wall Street firms is relatively low.
The Cboe VIX has plunged this year, but is still above a five-year low of 10.17 set Aug. 9, 2018, according to MarketSmith.
Sentiment gauges tend to work best at market extremes. Yet sentiment gauges can remain at “overbought” levels for a long time before the demand for stocks truly evaporates and a steep decline begins.
The Latest In IBD Videos
Political Risks In Stock Market Forecast For Next Six Months
Investors also need to keep an eye on what happens in Washington, D.C.
Jeannette Lowe, Washington policy analyst at Strategas, believes the end of the student loan payment moratorium is meaningful this year. She estimates that this policy change could result in an average bump up of $380 per month in payments for each college loan borrower. This could hit spending by consumers. And it could lower the nation’s gross domestic product by 0.2%-0.4% from now until the end of this year.
“We’ve seen lower income tax refunds this year as well,” Lowe said in a note to clients. The need for fiscal austerity will fuel fierce debates on Capitol Hill in the years to come.
The late-May debt ceiling deal does not have as large a spending cut as the $2 trillion agreed during the 2011 debt ceiling battle. Yet “ultimately we believe this is only the first step in a larger trend of more fiscal austerity in the U.S.,” Lowe said.
Supreme Court Ruling May Raise U.S. Recession Risk
The Pace Of The Stock Market Rally
Certainly, this year’s bull market has not seen a rapid rise off the lows. Maybe this is a reason why the stock market forecast for the remainder of 2023 lacks general enthusiasm.
But Adam Turnquist, chief technical strategist at LPL Financial (LPLA), says forward returns tend to be strong after indexes have reached the proverbial “20% threshold” of gains off the lows that make the switch from a bear market to a bull.
According to LPL Financial, the S&P 500 has posted average and median gains of 18% to 19% in the 12 months after the index cleared this 20% minimum rally.
Also, the S&P 500’s ability to clear resistance near 4300 is a good sign for the current stock market forecast.
“It marks a major retracement level of last year’s bear market and the August (2022) highs,” Turnquist said in a note sent to IBD.
FOMO Buying In The Stock Market Forecast For The Next Six Months
Many feel the tech sector — the main engine of this year’s rally — has become overbought. A consolidation or pullback in tech stocks could make 4300 “a challenging hurdle to clear on a sustainable basis,” Turnquist added.
Yet if the move past 4300 is sustained, investors who either have a fear of missing out (FOMO) or close out short positions could help gains accelerate.