 The stablecoin sector experienced a $3.26 billion expansion within the last eight days, climbing from $140.82 billion to $144.08 billion by Sunday, March 3, 2024. During February, increases in supply were observed in four of the top five stablecoins by market cap, with FDUSD’s supply growth leading amongst the five. Stablecoin Economy Rises 2.31% in […]
Source link
supply
U.S. Money Supply Is Making History for the First Time Since the Great Depression, and It Implies a Big Move in Stocks Is on the Way
Over lengthy periods, it’s tough to outpace equities in the return column. Compared to gold, oil, housing, and Treasury bonds, the annualized return of stocks trumps them all over the long run.
However, the predictability of directional moves in the Dow Jones Industrial Average (DJINDICES: ^DJI), S&P 500 (SNPINDEX: ^GSPC), and Nasdaq Composite (NASDAQINDEX: ^IXIC) gets thrown out the window when the time frame is narrowed. Since the start of 2020, these three indexes have traded off bear and bull markets in successive years.

Even though forecasting directional moves for the major indexes can’t be done with 100% accuracy, it doesn’t stop investors from trying to gain an edge. This is where a very select group of economic data points and predictive indicators comes into play. Though Wall Street offers no short-term guarantees, a couple of data points and indicators do have exceptional track records of correlating with moves higher or lower in the broader market.
One such data point that speaks volumes at the moment is U.S. money supply.
U.S. money supply hasn’t done this since 1933
Among the five money supply measures, two receive the bulk of the attention from economists and investors: M1 and M2. M1 factors in all the cash and coins in circulation, as well as demand deposits in a checking account. Think of M1 as cash that’s easily accessible and can be spent in the blink of an eye.
Meanwhile, M2 takes into account everything in M1 and adds in savings accounts, money market accounts, and certificates of deposit (CDs) below $100,000. M2 is still factoring in cash that consumers can spend, but it’s adding in capital that takes a bit more effort to get to. It’s this figure, M2, that is causing alarm in the investing world.
For well over a century, U.S. money supply has been rising with little interruption. Since a growing economy requires more cash and coins in circulation to complete transactions, rising money supply is something economists and investors tend to take for granted and assume is a given.
But on rare occasions, U.S. money supply contracts in a big way — and that’s historically portended bad news for the U.S. economy and stock market.
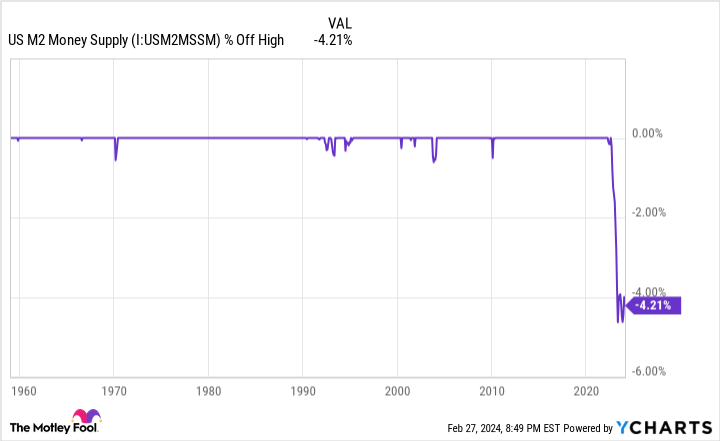
In July 2022, U.S. M2 money supply peaked at an all-time high of roughly $21.7 trillion. Based on the Feb. 27 data release from the Board of Governors of the Federal Reserve, M2 stood at $20.78 trillion, as of January 2024. All told, we’re looking at a year-over-year drop of 1.44% and an aggregate decline from the July 2022 peak of 4.21%. This is the first significant drop in M2 since the Great Depression.
The caveat to the decline since July 2022 is that M2 expanded at a truly historic pace during the COVID-19 pandemic. Fiscal stimulus increased M2 by a record 26% on a year-over-year basis. Thus, a case could be made that a 4.21% retracement is merely a reversion to the mean. Then again, history has been incredibly unforgiving when M2 money supply has fallen by at least 2% on a year-over-year basis.
According to research conducted by Reventure Consulting CEO Nick Gerli, which relied on data from the U.S. Census Bureau and the Federal Reserve, there have only been five instances, when back-tested to 1870, where M2 has declined by at least 2%: 1878, 1893, 1921, 1931-1933, and July 2022 through at least January 2024. The previous four instances all coincided with deflationary depressions and double-digit unemployment rates.
WARNING: the Money Supply is officially contracting. 📉
This has only happened 4 previous times in last 150 years.
Each time a Depression with double-digit unemployment rates followed. 😬 pic.twitter.com/j3FE532oac
— Nick Gerli (@nickgerli1) March 8, 2023
If I can offer a ray of hope, two of the four previous incidences occurred prior to the creation of the nation’s central bank, and the other two date back more than nine decades. The Federal Reserve’s knowledge of monetary policy, and the fiscal tools available to the federal government, make it highly unlikely that a depression would materialize today.
On the flip side, declining money supply isn’t something that should be swept under the rug. If the core inflation rate remains above the Fed’s 2% long-term target and M2 continues to decline, there will be less discretionary income to go around.
Based on data from Bank of America Global Research, about two-thirds of the S&P 500’s max drawdowns occur after, not prior to, a U.S. recession being declared. In short, a persistent decline in M2 money supply could spell trouble for a currently red-hot stock market.
Following the money has been a problem for the past year
The worry for investors is that M2 represents just one money metric that looks to be working against the U.S. economy and stocks, as a whole. Another key money-based data point that’s cause for concern is commercial bank credit.
Commercial bank credit is reported by the Board of Governors of the Federal Reserve on a weekly basis and factors in all of the loans, leases, and securities held by U.S. commercial banks. Over the past 51 years, commercial bank credit has expanded from around $567 billion to roughly $17.44 trillion, as of the week ended Feb. 14, 2024.
Just as M2 rising over time makes complete sense, so does the regular expansion of commercial bank credit. As the U.S. economy grows, it’s only natural that consumers and businesses are going to increase their borrowing. Furthermore, commercial banks offset the cost of taking in deposits by lending.
Trouble arises when this steadily climbing metric heads decisively south.
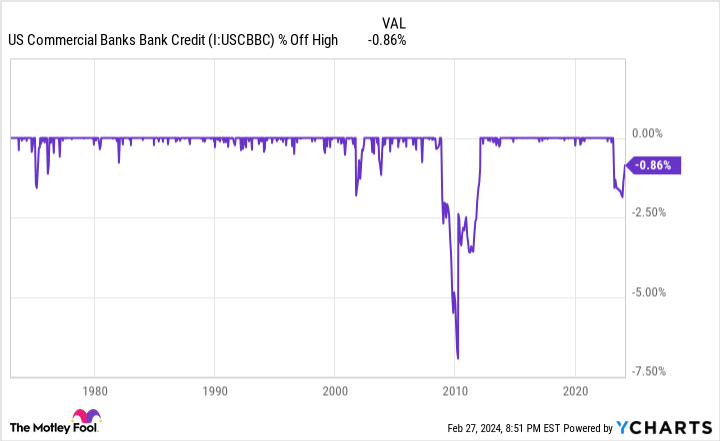
Since data reporting began in January 1973, there have only been three instances where commercial bank credit has pulled back at least 2% from its all-time high:
-
In October 2001, during the dot-com bubble, commercial bank credit slipped a maximum of 2.09%.
-
In March 2010, shortly after the Great Recession, commercial bank credit troughed at a 6.94% decline.
-
In November 2023, commercial bank credit hit a peak drop of 2.07%.
While it is worth noting that commercial bank credit has begun climbing in recent weeks, the drop throughout 2023 pretty clearly shows that banks have tightened their lending standards. When lending institutions become pickier about how they lend their money, it’s not uncommon for businesses to pare back hiring, innovation, and acquisitions. Put another way, a notable decline in commercial bank credit can be a precursor to an economic downturn.
Although Wall Street and the economy aren’t intertwined, recessions tend to negatively impact corporate earnings, which in turn would be expected to send the Dow Jones, S&P 500, and Nasdaq Composite lower. For context, the S&P 500 lost around half of its value during the previous two sizable contractions in commercial bank credit.

History is actually a long-term investors’ best friend
Considering that the Dow Jones Industrial Average and S&P 500 have rocketed to record-closing highs in 2024, a prognostication of downside in the broader market probably isn’t what you want to hear. But just as history can, at times, serve as a short-term guide that portends downside in stocks, it’s often the greatest ally of patient investors.
As much as workers and investors might dislike recessions, the fact remains that they’re a normal and unavoidable part of the economic cycle. They’re also notoriously short-lived. Only three recessions of the 12 that have occurred since the end of World War II made it to the 12-month mark, and none of the remaining three lasted longer than 18 months. In other words, downturns in the U.S. economy are fleeting.
Compare this to periods of growth over the past 78 years and change. Though there are a couple of growth spurts that lasted around a year, most expansions were multiyear events. In fact, two periods of growth surpassed the 10-year mark.
This disparity between U.S. economic growth and contractions is seen in Wall Street’s major indexes. As an example, the S&P 500 has endured 40 separate double-digit percentage corrections since the start of 1950. However, each and every one of these downturns was eventually put in the back seat by a bull market rally. Despite never knowing precisely when these declines will occur, history has pretty conclusively shown that the major indexes will rise in value over time.
To add to the above, the analysts at Bespoke Investment Group put out a dataset in June 2023 that compared the average length of bear markets in the benchmark S&P 500 to bull markets since the start of the Great Depression in September 1929. While the average bull market has endured 1,011 calendar days, the 27 bear markets over the past 94 years have stuck around for an average of only 286 calendar days (about 9.5 months).
The final data set that overwhelmingly demonstrates the power of time and perspective for investors is updated annually by Crestmont Research.
The researchers at Crestmont analyzed the rolling 20-year total returns, including dividends, of the S&P 500 dating back to 1900. Even though the S&P didn’t come into existence until 1923, researchers were able to trace its components to other major indexes at the time, thereby allowing total returns data to be back-tested to the start of the 20th century. This left Crestmont with 105 rolling 20-year periods (1919-2023) to analyze.
What Crestmont’s dataset showed is that all 105 rolling 20-year periods produced a positive total return. Hypothetically speaking, as long as an investor purchased an S&P 500 tracking index since 1900 and held that position for 20 years, they made money, without fail, every time.
No matter what M2 money supply and commercial bank credit suggest will happen with stocks, long-term investors are perfectly positioned to succeed.
Where to invest $1,000 right now
When our analyst team has a stock tip, it can pay to listen. After all, the newsletter they have run for over a decade, Motley Fool Stock Advisor, has nearly tripled the market.*
They just revealed what they believe are the 10 best stocks for investors to buy right now…
*Stock Advisor returns as of February 26, 2024
Bank of America is an advertising partner of The Ascent, a Motley Fool company. Sean Williams has positions in Bank of America. The Motley Fool has positions in and recommends Bank of America. The Motley Fool has a disclosure policy.
U.S. Money Supply Is Making History for the First Time Since the Great Depression, and It Implies a Big Move in Stocks Is on the Way was originally published by The Motley Fool
Quick Take
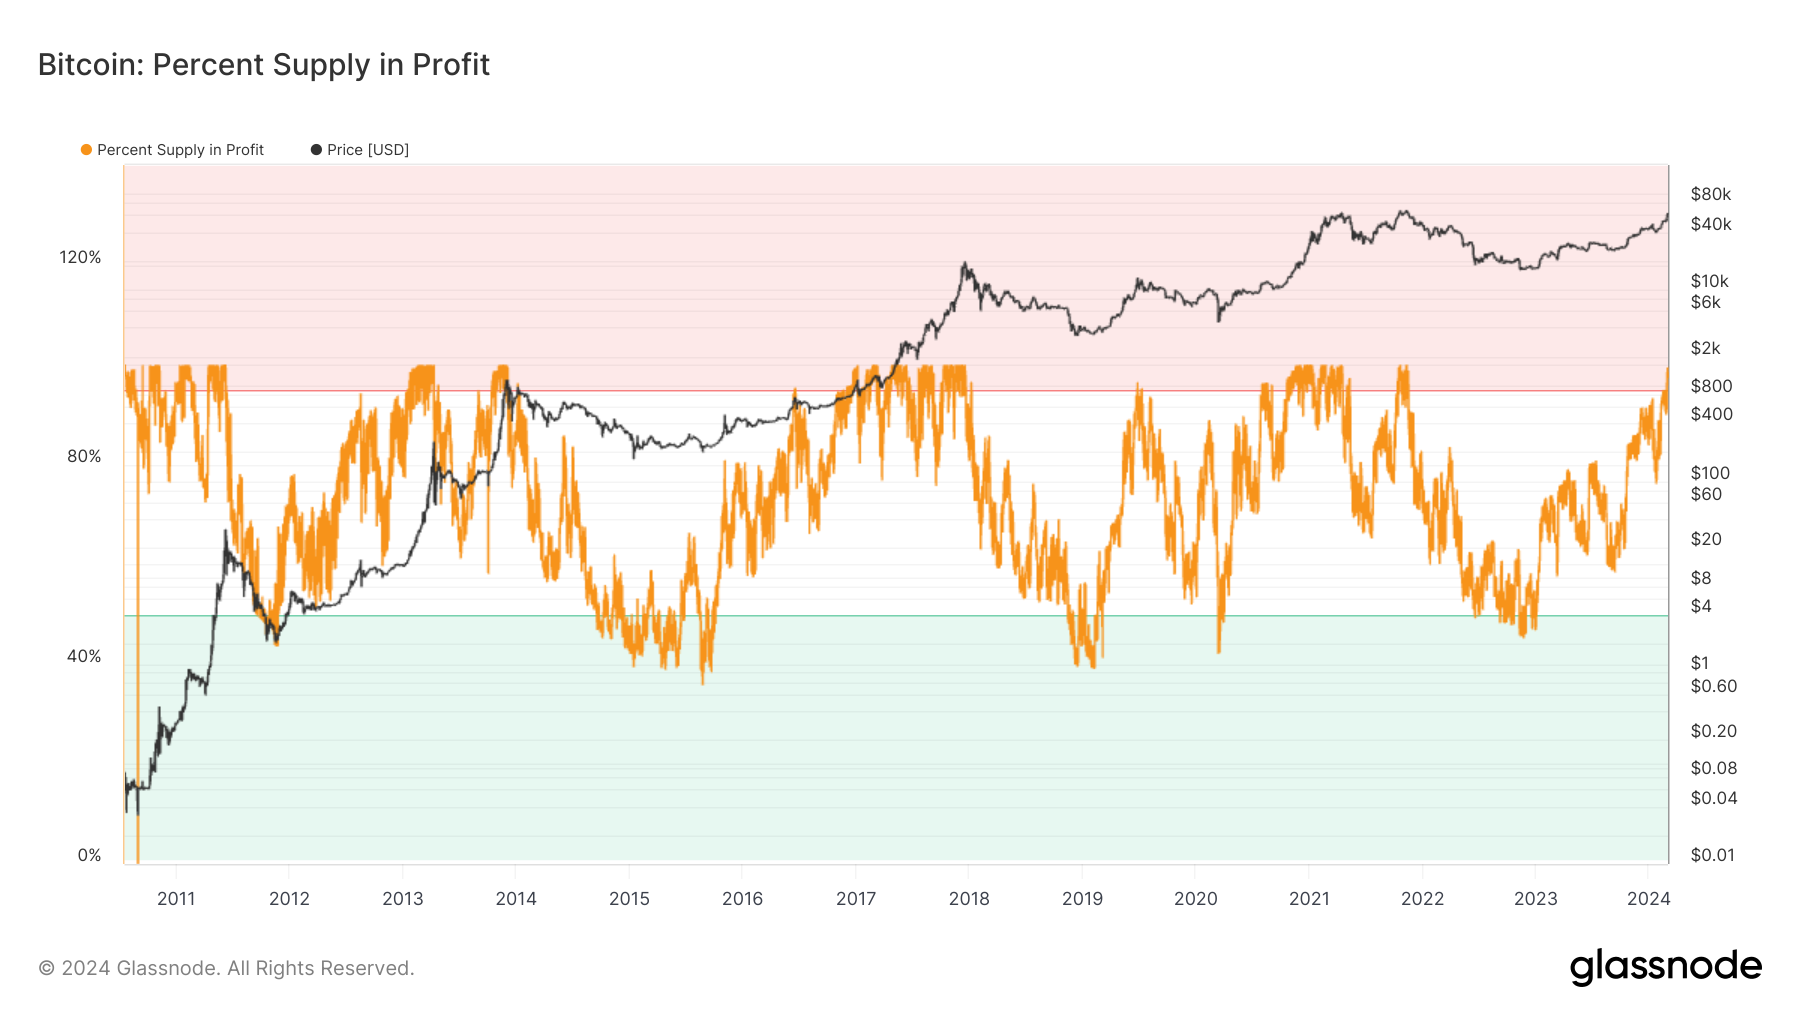
The past week saw Bitcoin reach a yearly high, hitting $64,000, causing the circulating supply in profit to reach a staggering 99.6%. Notably, on Feb. 26, we observed the supply in profit elevate above 95% for the first time since November 2021, according to Glassnode.
As Bitcoin’s price appreciated from $51,000 to $64,000 this week, a wave of profit-taking was triggered. Short-term holders, those holding Bitcoin for less than 155 days, transferred $3 billion in profits to exchanges. This forms part of a 128-day streak of realized net profits, indicative of the current market regime.
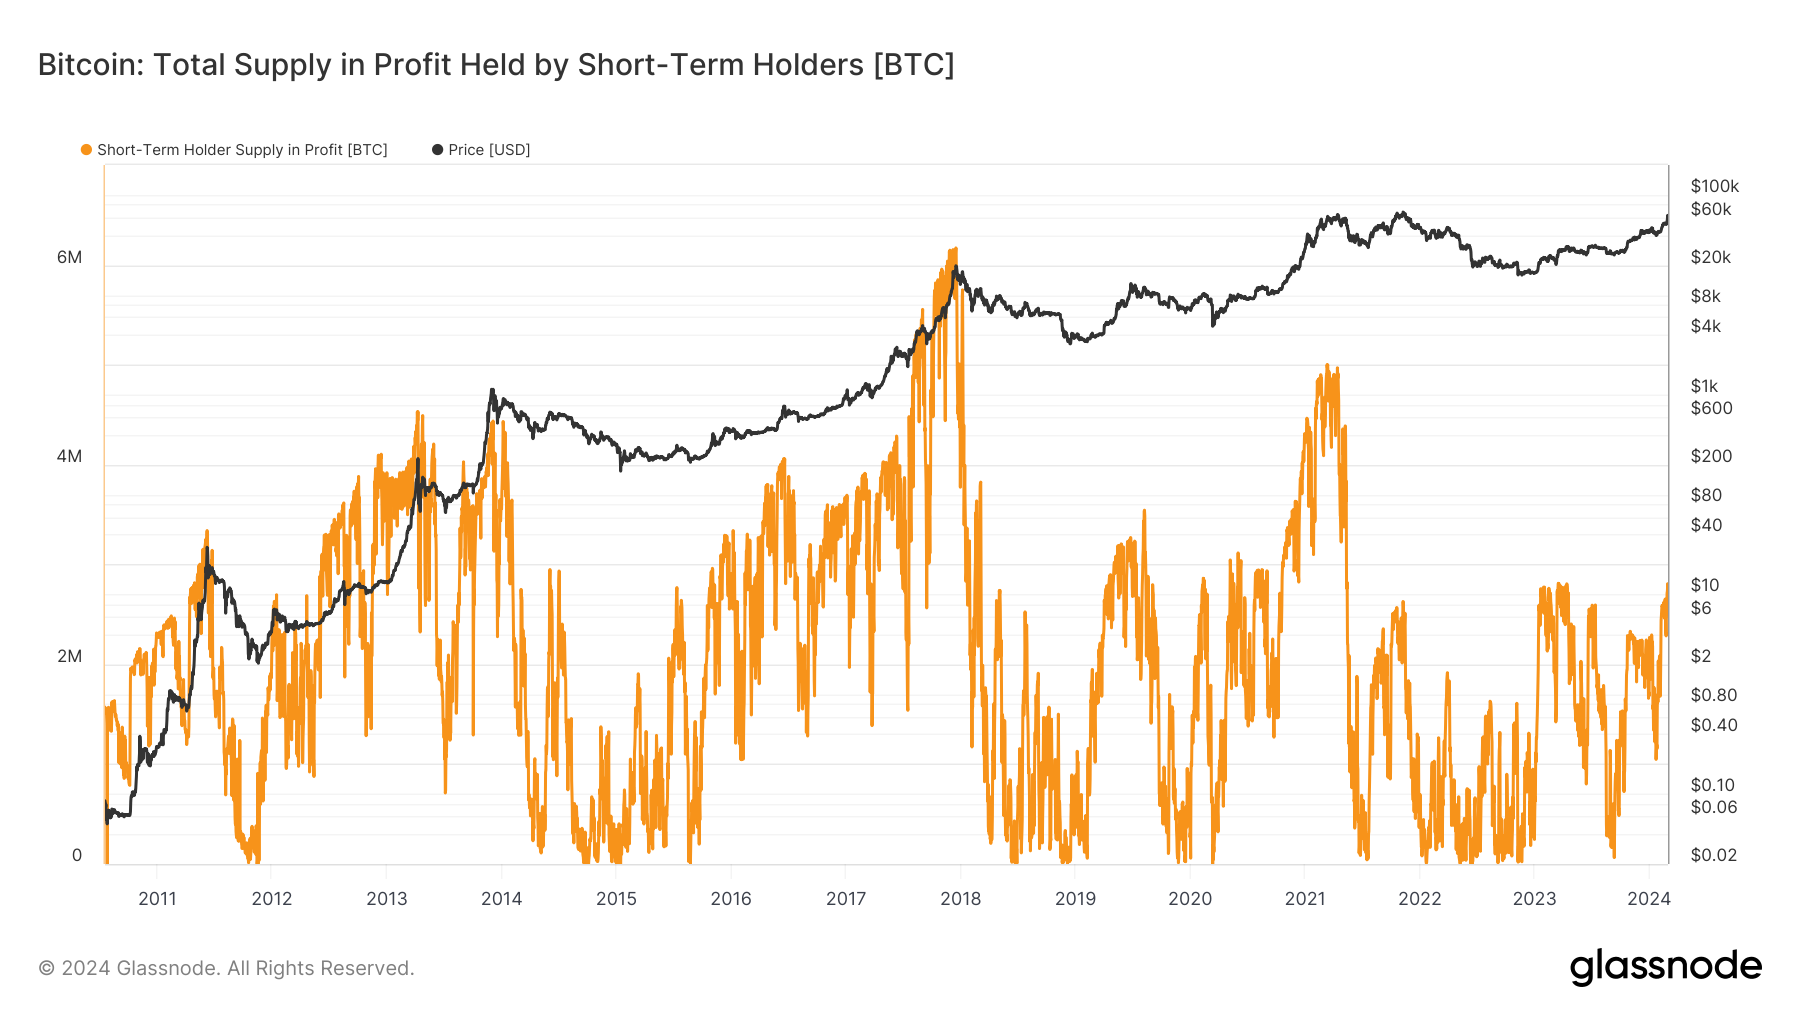
Interestingly, these short-term holders only account for 2.83 million BTC, with approximately 2.7 million being in profit, according to Glassnode.
Looking back at previous bull runs, we’ve seen figures as high as 4 and 6 million BTC in profit from short-term holders. This disparity highlights the potential for growth as short-term holders continue to buy Bitcoin.
The post Bitcoin’s surge to yearly high marked 99.6% of its supply in profit appeared first on CryptoSlate.
Seven days after the new Bitcoin ETFs launched, I analyzed how they could put pressure on Bitcoin’s supply dynamics in an article called “If BlackRock continues 6k BTC daily buys, we get a supply crunch within 18 months; here’s why.’ On the day of publication, Jan. 18, Bitcoin closed at $41,248 after falling from a high of $49,000 on Jan. 11. Since then, the flagship digital asset has soared 37% to break $57,000.
While Bitcoin had fallen consistently after the ETF launched, CryptoSlate noted the persistent BTC inflows, which, at the time, averaged around 6,266 BTC per day for BlackRock alone. The analysis identified that were such inflows continue, the liquid supply of Bitcoin could be absorbed this year, with the exchange balances or very liquid supplies targetable by mid-2025.

As noted at the time, the analysis was purely hypothetical and did not consider the outflows from Grayscale GBTC. Additionally, it only looked at BlackRock, the largest fund’s inflows, to simplify the data at that point. The exercise aimed to emphasize the potential for a supply squeeze and the lack of liquid Bitcoin to facilitate persistent ETF pressure on the supply. On Jan. 18, BlackRock had 25,067 BTC under management, valued at $1 billion.

Interestingly, while the inflows into BlackRock did not maintain the 6,266 BTC daily average pressure, inflows into the Newborn Nine have surpassed this level. BlackRock currently has 130,231 BTC under management, whereas the fund would have 275,707 BTC if it continued at 6,266 BTC daily. However, on Jan. 18, 6,266 BTC was valued at $258 million, which would now represent an inflow of $357 million, given the dramatic price surge.

It’s important to remember that the spot Bitcoin ETFs are purchased with dollars and denominated in dollars in a brokerage account. Thus, while inflows into the ETF have been consistent in dollar terms, they have been reduced in terms of Bitcoin purchases.
Across the Newborn Nine, 303,002 BTC is now held under management per K33 Research. Looking at the CryptoSlate table used for the Jan. 18 article, this aligns with inflows projected for BlackRock by March 2, 2024.

Using this data, should the Newborn Nine continue to absorb Grayscale’s declining outflows and purchase additional Bitcoin from the broader market at this pace, 1 million BTC could be under management by June. Further, this rate would swallow the BTC equivalent of the entire current liquid supply of Bitcoin (roughly 1.3 million BTC) by September.
On Feb. 8, I discussed the potential for the ‘Mother of all Supply Squeezes‘ for Bitcoin, which is akin to the GameStop saga but even more effective. The price has surged 29% since that article went live in just 19 days, an average of 0.65% per day. Bitcoin ETFs have continued to buy, and Grayscale’s outflows are slowing.
The requirements for a supply squeeze appear to be present; the only question I see is, at what level does the demand become affected by the price? Do Bitcoin ETF purchasers continue to buy if Bitcoin is at $100,000? Well, at that price, BlackRock’s IBIT would be around $60 per share. That doesn’t sound quite as expensive to new investors now, does it?
Surge in stablecoin supply ratio signals increased Bitcoin buying power
Quick Take
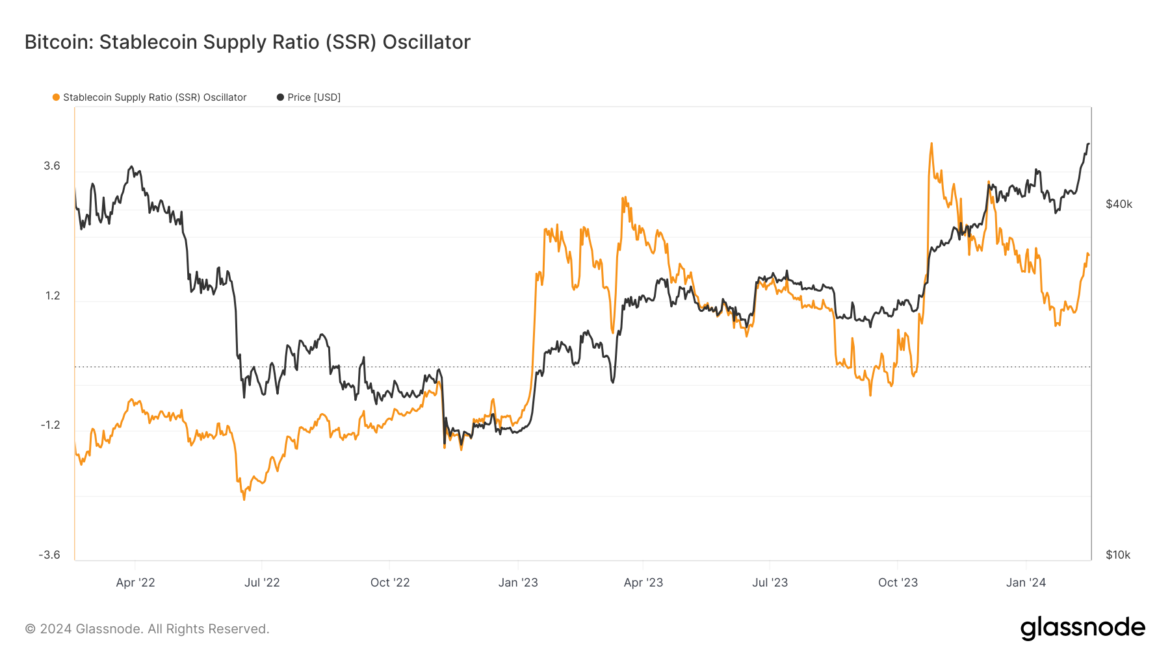
The Stablecoin Supply Ratio (SSR), a key metric that quantifies the supply forces between Bitcoin and various stablecoins, has been signaling increased “buying power” for Bitcoin in the past ten days.
Glassnode defines the SSR as the ratio of Bitcoin’s market cap to that of stablecoins denoted in Bitcoin, which serves as a proxy for the demand-supply mechanics of BTC versus USD. When the SSR dips, it implies a heightened buying power for the current stablecoin supply to purchase Bitcoin.
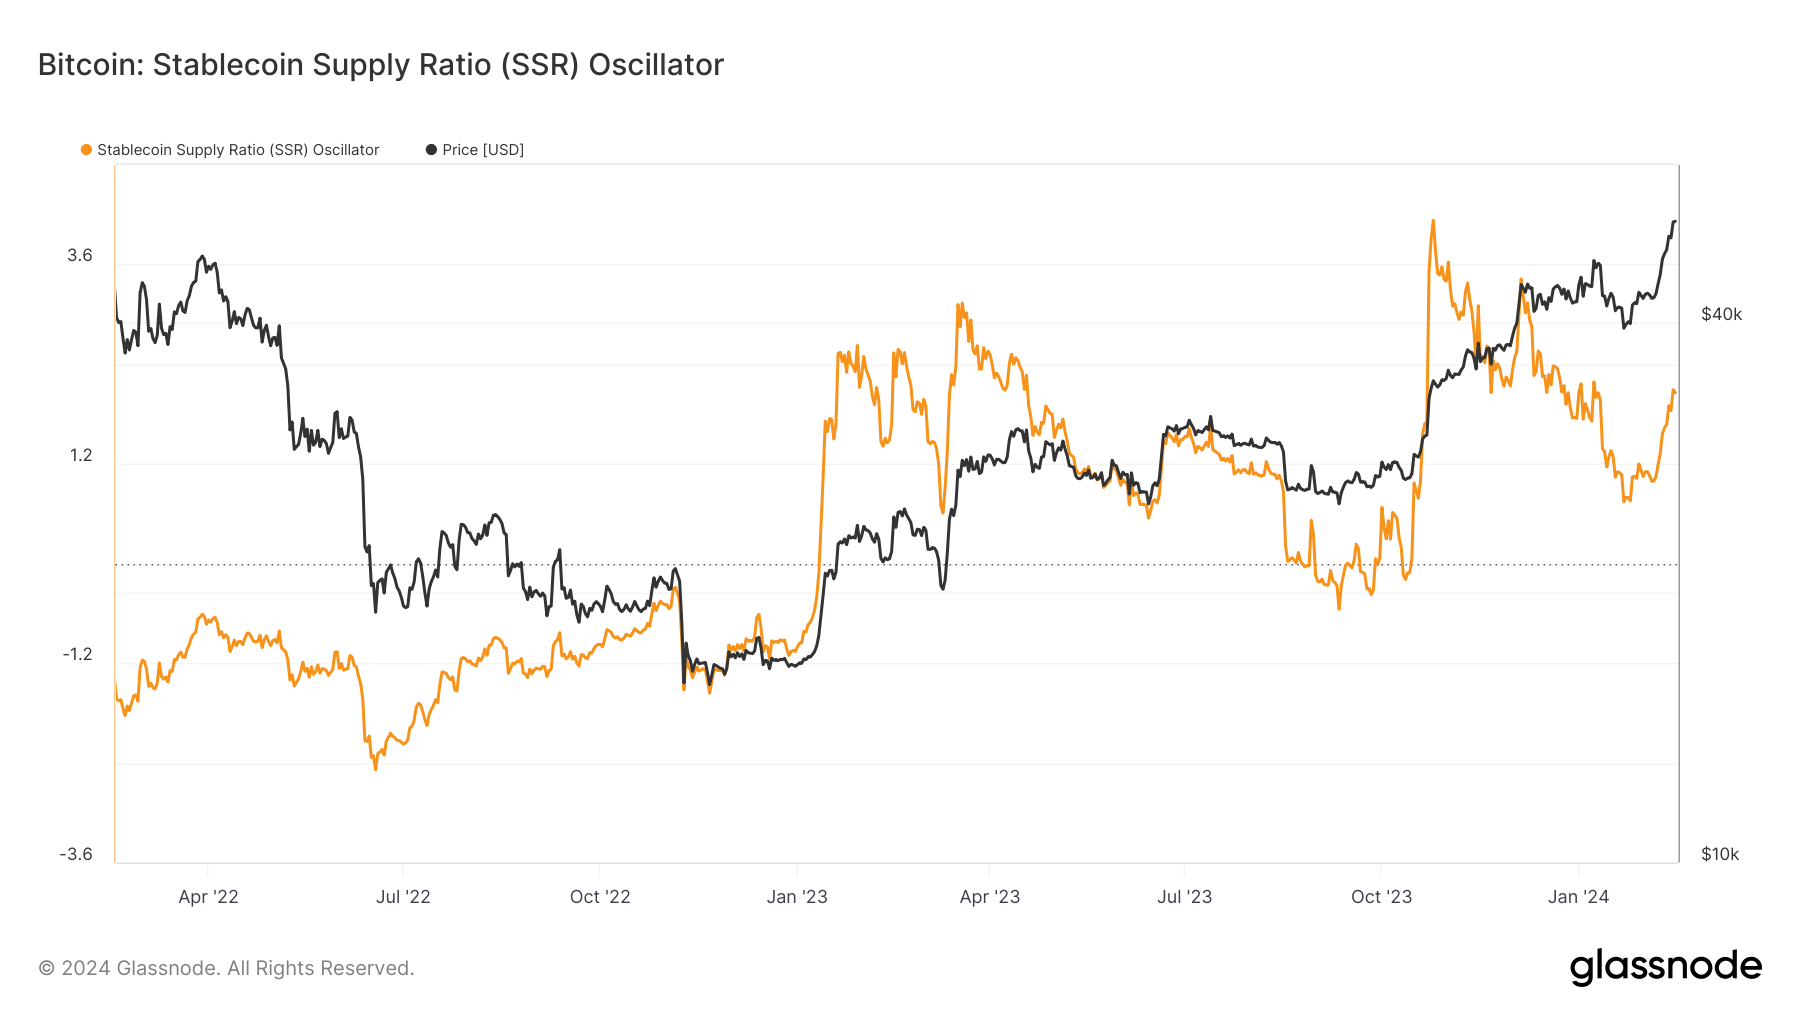
Three weeks ago, CryptoSlate observed a subtle upsurge in the SSR, from 0.74 to 1.04, corresponding to an increase in Bitcoin’s value to $42,000. Back then, the SSR was at 1.04, and it is now at 2.04. The upward movement started on Feb. 8 and coincided with the rise in Bitcoin price to $52,000.
This suggests that the demand for Bitcoin is driven by ETF interest and stablecoin liquidity entering the Bitcoin market.
The post Surge in stablecoin supply ratio signals increased Bitcoin buying power appeared first on CryptoSlate.
Raging Inferno: Over 3% of All Ether Supply Has Been Burned Since Implementing EIP-1559
 Ethereum has shed a significant part of its supply since the London upgrade, applied in August 2021. According to ultrasound.money, a portal that records several statistics associated with the ETH burn, over 4 million ether (3.2%) have been removed from the network since the adoption of EIP-1559, which changed how fees are calculated. EIP-1559 Burns […]
Source link
Over 92% of Bitcoin supply now profitable as price soars past $47,000
Quick Take
Bitcoin’s recent surge past $47,000 is accompanied by a notable development — over 92.5% of its circulating supply is now in profit. The figure represents the percentage of existing coins whose price at their last movement was lower than the current price.
Interestingly, during Bitcoin’s previous peak at $49,000, just above 93% of the supply was in profit, reflecting a correlation between the digital currency’s price increase and the percentage of its supply in profit.
Historical data offers another intriguing perspective. When over 95% of Bitcoin’s supply was in profit, it has typically indicated a local top in the price. The last instance was in November 2021, when Bitcoin reached its all-time high of $69,000.
Conversely, when less than 50% of its supply was in profit, it usually pointed to a price floor. The most recent occurrences were during the FTX collapse in November 2022 and the COVID-19 pandemic’s market impact in March 2020.

The post Over 92% of Bitcoin supply now profitable as price soars past $47,000 appeared first on CryptoSlate.
Bitcoin Supply On Exchanges Has Dropped To A 6-Year Low, What This Means For Price
Bitcoin broke over the $46,000 level twice in the past 24 hours for the first time since the approval of spot Bitcoin ETFs by the SEC, signaling a bullish return into most cryptocurrencies spearheaded by BTC. In particular, Bitcoin investors seem to be gearing up for action as the next Bitcoin halving approaches with an interesting time of withdrawal from exchanges.
Serious money has been on the move from exchanges in the past 30 days, as shown by on-chain data. As a result, the Bitcoin balance across various exchanges has seen a drastic drop to the lowest level in six years.
Percentage Of Bitcoin Supply On Exchanges Drops To Lowest Level Since 2017
A large portion of Bitcoin holders have been holding onto their coins for the long haul. According to IntoTheBlock data, about 69% of Bitcoin holders have been holding their coins for longer than one year.
Data from the on-chain analytics platform Santiment also showed that the supply of Bitcoin on exchanges recently dropped to 5.3% of the total circulating supply for the first time since December 2017, indicating 94.7% of the supply is currently in private custody. This metric is particularly interesting, considering BTC’s total circulating supply has grown by 2.84 million since December 2017.
As shown in Santiment’s chart, the supply on exchanges has been on a free fall since January 10, around when the first spot Bitcoin ETFs went live in the US. This isn’t surprising, as the sentiment around Bitcoin turned fully bullish during this period despite a prolonged price struggle.
📈 #Bitcoin‘s price dominance has continued to grow over #altcoins, as its market value surged as high as $45.5K today. Traders remain skeptical toward the asset for a 3rd straight week. This is the lowest ratio of $BTC on exchanges since December, 2017. pic.twitter.com/4MwvXE28RC
— Santiment (@santimentfeed) February 8, 2024
In a similar manner, whale transaction tracker Whale Alerts has disclosed large bouts of BTC exiting crypto exchanges to private wallets in the past month. Notably, Bitcoin’s dominance over altcoins has gained ground, with the institutional demand for Bitcoin post-ETF approval also surging.
🚨 🚨 🚨 1,150 #BTC (51,452,847 USD) transferred from #Coinbase to unknown wallet
— Whale Alert (@whale_alert) February 8, 2024
This mass BTC exodus from crypto exchanges signals that long-term holders feel more comfortable keeping their coins in self-custody rather than on exchanges.
The total Bitcoin withdrawals from exchanges in the past seven days were to the tune of $8.64 billion, outpacing a $8.42 billion inflow by $220 million. Wallets holding more than 1,000 BTC have also accumulated 1.03% of the total circulating supply in the past month.
Withdrawals from exchanges are generally a good phenomenon for crypto assets, as they reduce the amount of cryptocurrencies readily available for sale. Fewer BTC available means less selling pressure and the opportunity for the value to go up based on supply and demand.
At the time of writing, Bitcoin is trading at $46,250, up by 4% in the past 24 hours and 7.15% in the past seven days. The cryptocurrency is currently aiming for the $50,000 mark, which it can reach very soon if the accumulation strategy continues.
BTC price crosses $47,000 | Source: BTCUSD on Tradingview.com
Featured image from Forbes, chart from Tradingview.com
Disclaimer: The article is provided for educational purposes only. It does not represent the opinions of NewsBTC on whether to buy, sell or hold any investments and naturally investing carries risks. You are advised to conduct your own research before making any investment decisions. Use information provided on this website entirely at your own risk.
Quick Take
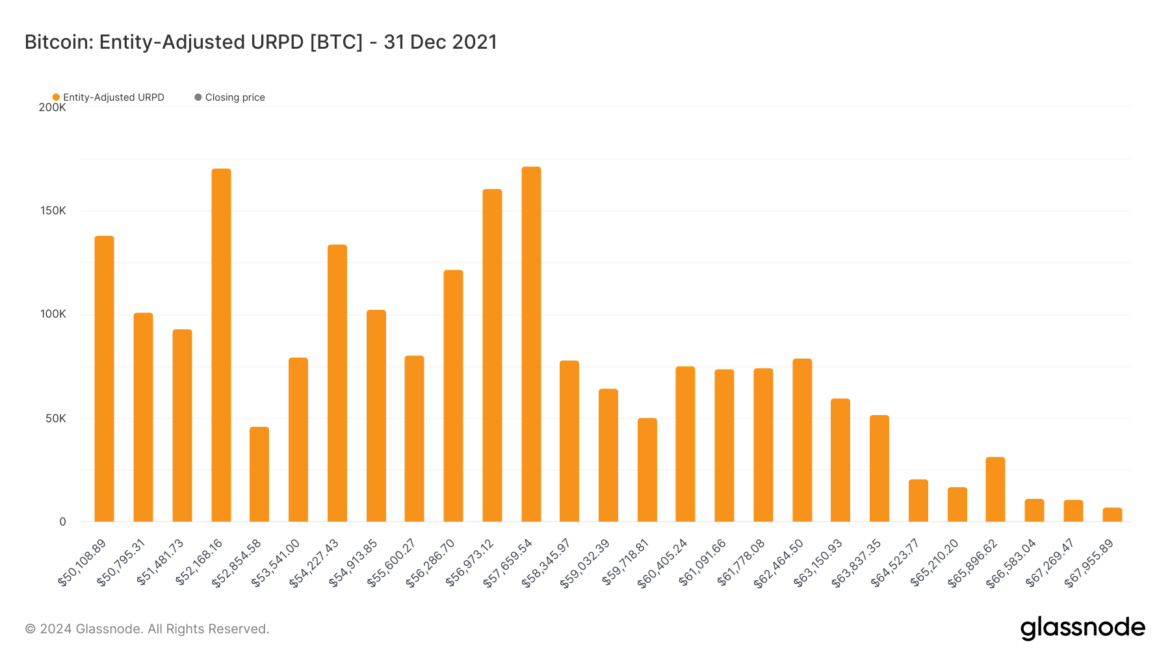
The UTXO Realized Price Distribution (URPD) metric by Glassnode offers a snapshot of the prices at which the existing Bitcoin UTXOs were established. Each bar on the graph represents the Bitcoin in circulation that was last transferred within a particular price range.
Since the bull run of 2021, when Bitcoin reached an all-time high of approximately $69,000, the percentage of total supply sitting above $50,000 has decreased dramatically. As of Feb. 5, 2024, only about 3.5% of Bitcoin’s supply sits in this price bracket, down from around 13% as of Dec. 31, 2021. This data suggests a significant sell-off over the past 24 months, as Bitcoin went as low as $15,500 during the FTX collapse.

Concurrently, a noticeable consolidation is observed around the $40,000-$44,000 price range, accounting for approximately 13% of the current total supply. This indicates an accumulation phase, where investors are holding onto Bitcoin in anticipation of a potential price surge due to the ETFs and an upcoming halving.

The post Dramatic decrease in Bitcoin supply above $50,000 appeared first on CryptoSlate.
Bitcoin’s realized price by ‘young supply’ underpins recent price support
The anticipation of the first spot Bitcoin ETFs in the U.S. fueled Bitcoin to a 21-month high of $49,000. However, the high it reached on Jan. 10 was short-lived, as the price dropped swiftly and sharply to a low of $39,450 on Jan. 21. This sharp decline, which many deemed a classic case of “buy the rumor, sell the news,” was significant but not as catastrophic as it could have been. By Jan. 24, Bitcoin had bounced back, regaining the critical $40,000 level.
CryptoSlate’s previous analysis shed light on the market’s robustness in the face of this volatility. The market demonstrated an impressive capacity to absorb considerable selling pressures, effectively curbing additional liquidations and providing a buffer against further price decline.
Another pivotal element that helped maintain Bitcoin’s price above $39,000 has been the realized price. The realized price indicates the aggregate price at which each coin was last moved on-chain. This metric is crucial in on-chain analysis, as it shows the average acquisition price of Bitcoin across different investor cohorts. By analyzing this, we can see the average cost basis of Bitcoin holders and estimate potential support and resistance levels.
However, a general assessment of Bitcoin’s cost basis offers limited insights. The realized price of the young supply – coins that have moved within the last six months – provides a more accurate reflection of the market sentiment. The young supply realized price, utilizing a 120-day exponential moving average, is a much better indicator of short-term holder behavior.
Data from Glassnode puts the realized supply of young supply at $38,370, significantly higher than the old supply’s realized price of $25,886. The realized price for young supply saw a relatively small increase between Jan. 10 and Jan. 25, while the realized price for old supply remained stable.
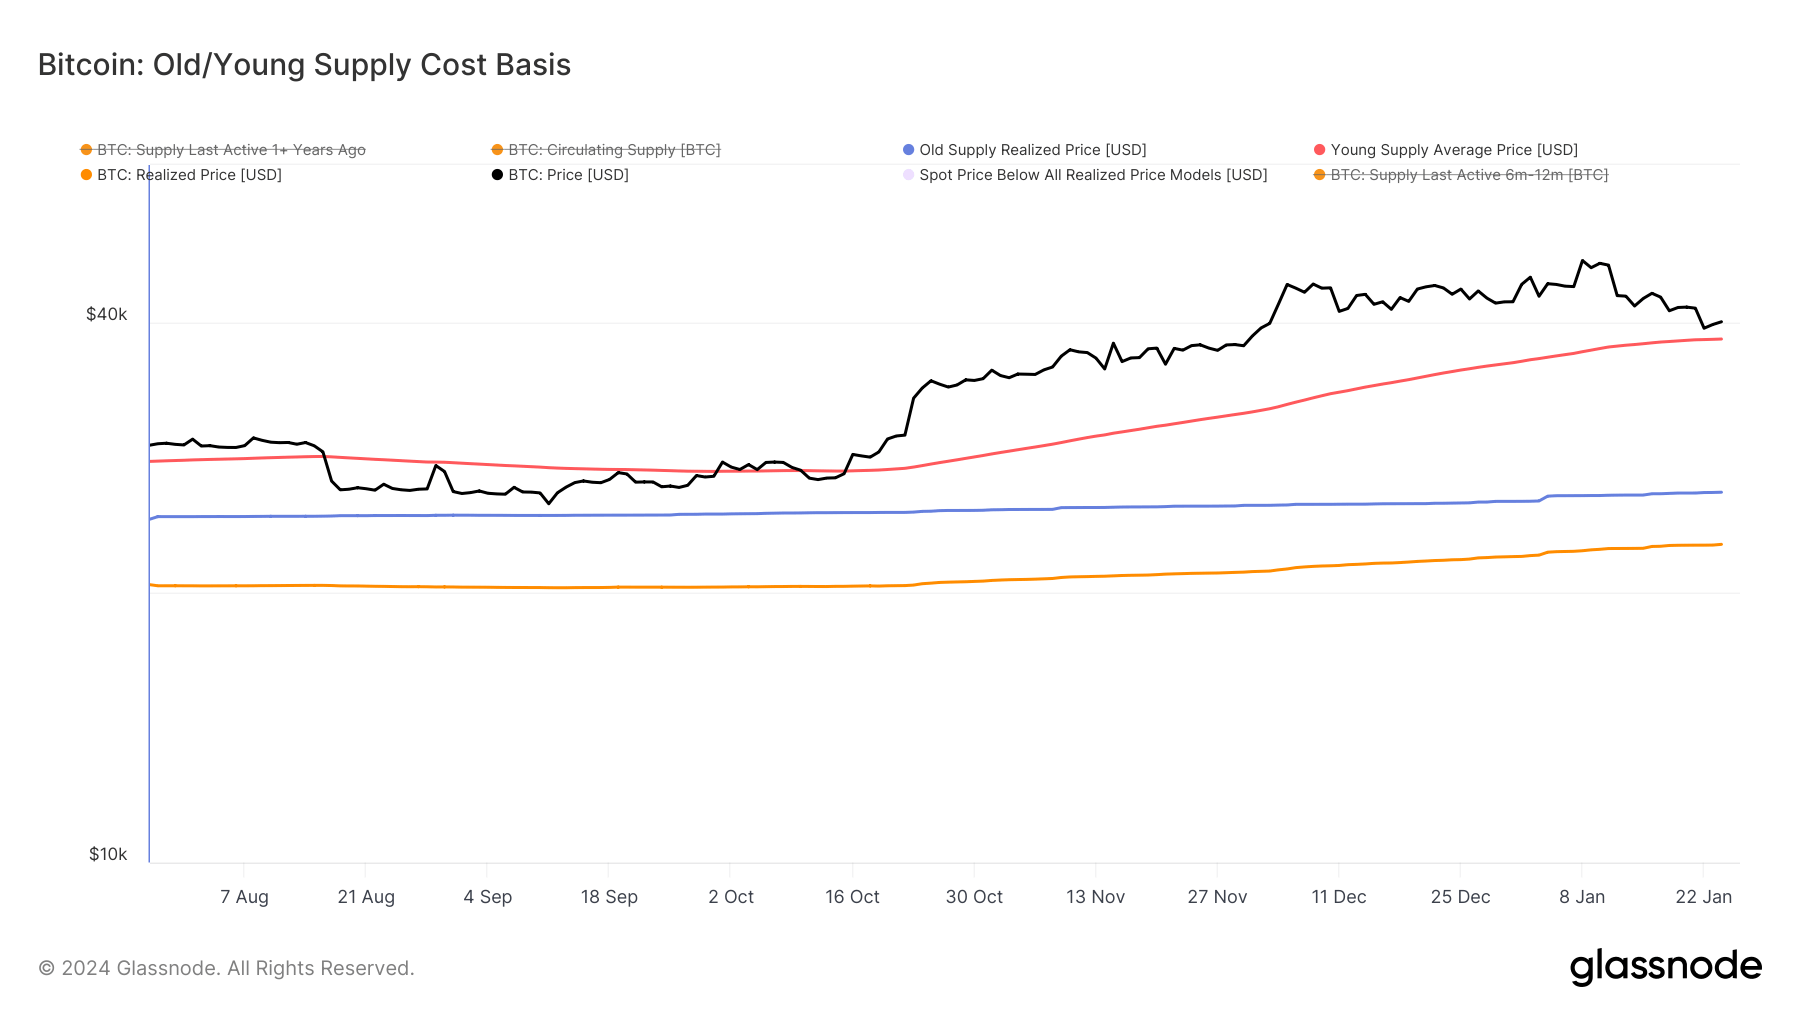
The lack of significant movement in the realized price for young supply created robust support for Bitcoin’s price at $39,000. Young supply, also referred to as short-term holders, react quickly and aggressively to price swings, and periods, where Bitcoin’s spot price fell below its cost basis, have often triggered a prolonged downward trend. The fact that Bitcoin’s price drop stopped at 16% could be attributed to the support created by the young supply’s realized price.
It serves as a very rough estimate of the price level recent investors are likely to defend and a level below which they could begin to capitulate.
The post Bitcoin’s realized price by ‘young supply’ underpins recent price support appeared first on CryptoSlate.


