 Veteran trader Peter Brandt has provided an update on his bitcoin price prediction. He explained that the price target for “the current bull market cycle” scheduled to end in Aug/Sep next year has been raised from $120,000 to $200,000. Peter Brandt on Bitcoin Bull Market Cycle Peter Brandt provided an update on his bitcoin price […]
Source link
target
Ethereum (ETH) is showing a noteworthy pattern in the options market. According to data from Deribit, a leading platform for crypto futures and options trading, there’s a significant concentration of call options for ETH around the $4,000 strike price for both the June and September expiries.
Options Traders Anticipate $4,000 Ethereum
This accumulation of ETH call options centered on the $4,000 mark indicates a concentrated expectation among traders that the price of Ethereum could rise to, or above, $4,000 by these dates.
For context, options are financial derivatives that give the buyer the right, but not the obligation, to buy (in the case of call options) or sell (put options) the underlying asset at a predetermined price on or before a specified date.
Notably, according to a chart from the crypto futures and options trading platform, the $4,000 ETH strike price emerged as the dominant position in the ETH options trading landscape, surpassing other strike prices for the June and September expiry dates.

It is worth noting that such a pattern indicates market sentiment and can influence trading strategies. In this instance, the pattern implies that most options traders are likely bullish on Ethereum, anticipating a notable increase in its value.
Furthermore, this trend might lead fundamental traders to reconsider their positions on Ethereum, potentially shifting their outlook to expect an upward trajectory in the asset’s performance.
Factors Influencing $4,000 ETH Options Strike Price
This clustering of Ethereum call options at the $4,000 strike price appears to be influenced by several factors, including the potential approval of a spot Ethereum exchange-traded fund (ETF) by the US. Securities and Exchange Commission (SEC).
With the final decision deadline for these spot ETF applications set for May 23, traders seem to be positioning their Ethereum options contracts in anticipation of a favorable outcome, as observed by Bitfinex’s Head of Derivatives, Jag Kooner.
However, Deribit’s Chief Commercial Officer, Luuk Strijers, cautions against drawing definitive “conclusions” about the link between the derivatives market and the Ethereum spot ETF approval expectations.
Strijers notes that while the “June skew” is higher, indicating more “expensive calls,” it’s challenging to pinpoint this precisely to the spot ETF news or expected correlation with the upcoming Bitcoin halving.
Meanwhile, Altcoin Daily crypto analysts recently outlined three key factors that could propel Ethereum’s price to $4,000. Among these factors, the anticipation and potential approval of Ethereum Spot Exchange-Traded Funds (ETFs) were highlighted as a major catalyst.
While Ethereum futures have already gained global acceptance, analysts emphasize that the green light for these spot ETFs could significantly trigger Ethereum’s long-term price appreciation.
Regardless of this contrasting ETH view, ETH currently trades at $2,495, showing a 7.7% increase in the past week and a 1.9% rise in the past 24 hours.
Featured image from Unsplash, Chart from TradingView
Disclaimer: The article is provided for educational purposes only. It does not represent the opinions of NewsBTC on whether to buy, sell or hold any investments and naturally investing carries risks. You are advised to conduct your own research before making any investment decisions. Use information provided on this website entirely at your own risk.
Crypto CEO Says Get Ready For Solana To ‘Rally Higher Again’ With New Target
Founder and Chief Executive Officer (CEO) of Evai Crypto Ratings, Matthew Dixon, has expressed optimism about the Solana future price outlook, projecting a new bullish target for the cryptocurrency.
CEO Predicts Bullish Outlook For Solana
In a recent post on X (formerly Twitter), Dixon shared a Solana and USD pair price chart originally published on TradingView, a crypto analysis platform. The crypto CEO indicated that the ongoing price correction for Solana, identified as “wave 4 (blue)” on the price chart, has not concluded and is expected to experience further declines.
He predicted that the ongoing wave 4 (blue) would reach a price level similar to Solana’s previous price correction, albeit to a lesser degree. The Evai CEO also anticipates that after the conclusion of the recent correction, Solana may experience a price rally once again.
Previously, Solana witnessed a major surge, nearly surpassing the $125 threshold. However, the cryptocurrency lost a substantial portion of its gains as the bullish hype faded, eventually settling below the $100 price mark at some point.
Additionally, on Tuesday, February 6, the Solana blockchain was temporarily halted due to an outage, resulting in no new blocks being produced for over 25 minutes. This unexpected disruption significantly impacted the overall sentiment of the cryptocurrency, causing slight declines in the price of SOL. Following this, a solution was coordinated among validators, and the network officially resumed operations.
Presenting another price chart for Solana, Dixon has projected a new upside target of $120 for the cryptocurrency. The crypto CEO has stated that despite the recent blackout, Solana has maintained both short-term and long-term positive prospects. Nonetheless, investors are advised to anticipate a potential mid-term price correction for the cryptocurrency.
SOL Price Surges Above $100 Mark
Reports from Santiment, a global market intelligence platform, have also indicated a bullish outlook for Solana. Earlier on Thursday, the crypto data platform disclosed on X that Solana is currently dominating the altcoin market and has become one of the few cryptocurrencies outperforming Bitcoin.
Santiment shared a price chart illustrating Solana’s recent price action, showcasing a robust climb over the past few days. According to their data, in the last 36 hours, Solana’s price relative to Bitcoin has increased by over 4.5%.
The cryptocurrency market intelligence platform disclosed that the outage earlier this week has instigated “Fear, Uncertainty and Doubt” (FUD) amongst investors, contributing to the current price rebound in Solana.
Solana rallied by almost 5% in the last day, and at the time of writing, the cryptocurrency is trading at a price of $105.46, reflecting a weekly increase of 4.39%, according to CoinMarketCap.
SOL price trending at $105 | Source: SOLUSD on Tradingview.com
Featured image from Crypto News, chart from Tradingview.com
Disclaimer: The article is provided for educational purposes only. It does not represent the opinions of NewsBTC on whether to buy, sell or hold any investments and naturally investing carries risks. You are advised to conduct your own research before making any investment decisions. Use information provided on this website entirely at your own risk.
In a move that could have ripple effects across Europe, Spain is tightening its grip on crypto monitoring and seizing digital assets for tax debts. The Ministry of Finance, led by María Jesús Montero, is spearheading legislative reforms to grant the Spanish Tax Agency enhanced powers to identify and seize crypto holdings from taxpayers with outstanding debts.
This follows a February 1st decree expanding the entities obligated to report tax information to the Treasury, encompassing banks, savings banks, and even electronic money institutions.
The measures come amidst Spain’s proactive approach to regulating the digital asset landscape ahead of the European Union’s Markets in Crypto-Assets Regulation (MiCA) framework, set for full implementation in December 2025.
Key Provisions Of The Crackdown
The proposed crackdown on cryptocurrency in Spain includes several key provisions aimed at strengthening the government’s ability to regulate and collect taxes in the digital asset space.
One major aspect of the legislative changes is the expansion of the Tax Agency’s authority, granting it the power to directly identify and seize assets associated with taxpayers having overdue debts.
Additionally, the February 1st decree widens the scope of entities obligated to report tax-related data to the Treasury. This now includes not only banks, savings banks, and credit cooperatives but also electronic money institutions. This expanded list potentially provides a broader framework for tracking digital currency transactions.
Spanish residents holding crypto assets on foreign platforms are subject to a mandatory declaration to the tax authorities by the end of March 2024. Initiated on January 1st, 2024, this declaration period requires individuals and corporations to disclose the value of their crypto holdings abroad as of December 31st, 2023.
Total crypto market cap at $1.61 trillion on the daily chart: TradingView.com
While all Spanish residents with foreign crypto holdings are required to make a declaration, only those exceeding €50,000 (approximately $54,000) are obliged to declare them for wealth tax purposes.
Individuals holding their crypto in self-custodied wallets, outside of exchange platforms, must report them through the standard wealth tax form. These measures collectively aim to establish a more robust regulatory framework for cryptocurrency transactions and holdings in Spain.
Spain At The Forefront Of Crypto Regulation
Spain’s proactive stance on crypto regulation positions the country as a frontrunner within the European Union. Notably, the country is implementing its own crypto regulatory framework ahead of the EU-wide MiCA framework coming into effect in late 2025. This preemptive approach underscores Spain’s commitment to establishing clear regulations within the crypto space.
Furthermore, Spanish tax authorities issued over 325,000 warnings in 2023 to residents who failed to declare their crypto holdings, marking a significant increase from the 150,000 warnings issued in 2022. This highlights the government’s growing focus on ensuring compliance within the crypto tax landscape.
Challenges And Considerations
While Spain’s efforts to regulate and tax cryptocurrencies are notable, some potential challenges remain. The rapid implementation of these changes might pose regulatory hurdles, requiring careful calibration to ensure effectiveness and minimize unintended consequences.
Additionally, accurately tracking and seizing self-custodied crypto assets, held outside of exchange platforms, could prove difficult due to the inherent anonymity associated with such wallets.
Global Implications
Spain’s move could serve as a precedent for other countries seeking to establish frameworks for monitoring and taxing cryptocurrencies. As the global crypto market continues to evolve, Spain’s proactive approach offers valuable insights for policymakers worldwide navigating the complexities of regulating this dynamic asset class.
Featured image from Pixabay, chart from TradingView
Disclaimer: The article is provided for educational purposes only. It does not represent the opinions of NewsBTC on whether to buy, sell or hold any investments and naturally investing carries risks. You are advised to conduct your own research before making any investment decisions. Use information provided on this website entirely at your own risk.
Chainlink (LINK) Price Breaks Out Of Bullish Flag Pole, Here’s The Next Target
The Chainlink (LINK) price has been on an impressive rally over the last week that has brought its price to new yearly highs. As LINK bulls continue to hold firmly above the $18 support, the emergence of this bullish rally has continued to signal that the price surge is far from over.
Crypto Analyst Says Chainlink Bullish Flag Has Been Broken
In an analysis posted on the TradingView website, crypto analyst CobraVanguard explains why the Chainlink price is currently very bullish. According to the analyst, despite the altcoin showing very bullish signs, a lot of traders are failing to realize that this is the case.
They identified a flag pole that was created in the chart, and in this case, the flag for the LINK price was actually bullish. Even more interesting is the fact that the analyst revealed that the Chainlink price had successfully broken this flag, which they say is bullish for the price.
Source: Tradingview.com
“LINKUSDT is in a Bullish flag Patter,” the analyst said. “We can expect a bullish movement as much as the Measured Price movement (flag pole) to happen!” This further solidifies LINK’s entrance into its most bullish phase so far in 2024.
Another major factor that the analyst identifies for the LINK price at this level is that the price was testing the major supply zone at $18. At the time, the LINK price had not cleared this level. But at the time of writing, LINk has broken clean off this major supply zone and is now trending toward $19. “The Flag Is Broken,” the crypto analyst declared.
What Are The Targets For The LINK Price?
In the chart shared in the analysis, the crypto analyst identifies two major points of interest in the Chainlink chart and these are the Supply Zone and the Target Price. The first, which is the Supply Zone, is at $18.3, and the LINK price has already broken above this level.
Given this, the next major point of interest is the Target Price, and CobraVanguard puts this at the $27 price level. However, there is no straight shot toward this level as the analyst’s chart also shows a correction below the $13 support before rallying onto its target.
If this analysis holds over the coming days/weeks, then the LINK price could see a sharp 20% correction as the first sign. Then from there, a complete 100% move upward to bring the price to the $27 price target.
At the time of writing, LINK bulls continue to show dominance after a sharp 7% move in the last day. On the broader chart, the LINK price is up 27% in the last week, bringing its market cap to $10.9 billion.
LINK bulls push price above $19 | Source: LINKUSDT on Tradingview.com
Featured image from Changelly, chart from Tradingview.com
Disclaimer: The article is provided for educational purposes only. It does not represent the opinions of NewsBTC on whether to buy, sell or hold any investments and naturally investing carries risks. You are advised to conduct your own research before making any investment decisions. Use information provided on this website entirely at your own risk.
Since the Shiba Inu (SHIB) reached a local high of $0.00001193 on December 16 last year, the price has been in a downtrend characterized by a series of lower highs and lower lows. However, renowned crypto analyst Ali Martinez has now discovered a rare bullish signal that could end this trend.
Shiba Inu Price Flashes Rare Bullish Signal
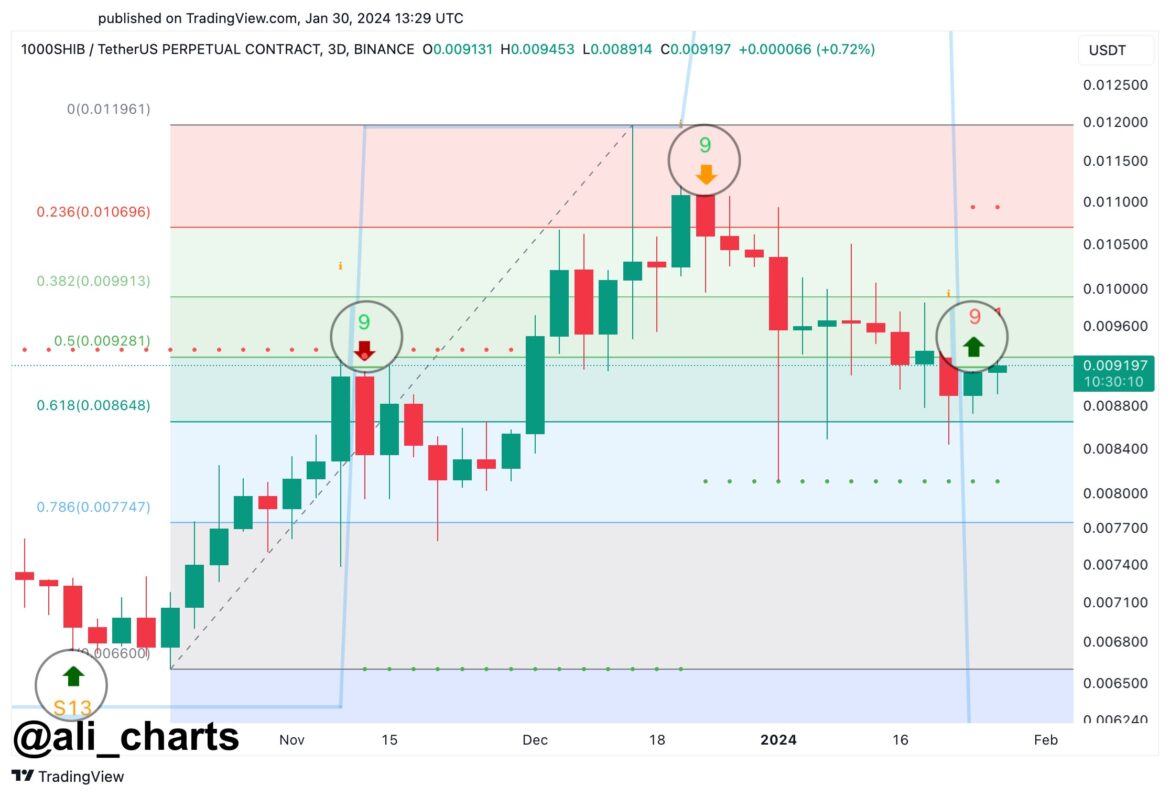
A recent analysis by Martinez (@ali_charts) indicates a potential bullish movement for Shiba Inu (SHIB) based on the TD Sequential indicator. Martinez’s chart, shared via X (formerly Twitter), shows SHIB in a 3-day timeframe against Tether (USDT) on the Binance exchange.

The TD Sequential indicator is a tool used to identify potential price points where an asset’s price is likely to experience an inflection – either a reversal or a continuation of the current trend. On Martinez’s chart, the indicator has presented a “buy signal,” specifically showing a green nine. This suggests the possibility that the current bearish trend could pause, and a bullish trend may ensue.
The chart exhibits a series of green and red candlesticks representing the price movements of SHIB over time. Green candlesticks indicate periods where the closing price was higher than the opening price, while red candlesticks show the opposite. The presence of a green nine suggests that after a succession of price declines over nine periods, the trend may be exhausted, and buyers may soon enter the market.
Martinez points out that the SHIB price is currently hovering around a Fibonacci retracement level of 0.5, at approximately $0.009281. Fibonacci retracement levels are horizontal lines that indicate where possible support and resistance levels might be located.
These are critical because they can indicate areas where the price of an asset may experience pullbacks or continuations. The chart also shows Fibonacci retracement levels at 0.236 ($0.010696), 0.382 ($0.009913), 0.618 ($0.008648), and 0.786 ($0.007747).
The chart analysis by Martinez highlights the potential for SHIB to rise to the $0.010 mark or even extend gains toward $0.011. These price levels are significant as they align with the 0.236 and 0.382 Fibonacci retracement levels, respectively, which may act as resistance points. A breach above these levels could validate the bullish signal provided by the TD Sequential indicator.
Marinez stated, “The TD Sequential indicator has proven remarkably precise in predicting Shiba Inu price movements. Currently, it’s flashing a buy signal, hinting that SHIB could be gearing up for an upswing. Keep an eye out, as SHIB could climb to $0.010 or potentially even reach $0.011!”
More Confirmation Needed
As the crypto market watches closely, the bullish signal for Shiba Inu at this juncture is noteworthy. However, as with any market prediction, it’s important to note that technical indicators are not infallible and should be considered as part of a broader strategy that includes fundamental analysis, market sentiment, and other technical indicators.
A look at the 4-hour chart of SHIB/USD shows that the price is still in a descending parallel trend channel. Yesterday, Tuesday, the Shiba Inu price was again rejected at the top of the trend channel. A breakout (at around $0.00000930) could be crucial to reinforce the TD9 signal.

Featured image created with DALL·E, chart from TradingView.com
Disclaimer: The article is provided for educational purposes only. It does not represent the opinions of NewsBTC on whether to buy, sell or hold any investments and naturally investing carries risks. You are advised to conduct your own research before making any investment decisions. Use information provided on this website entirely at your own risk.
Key Requirements For Spot XRP ETF Approval Revealed Amidst 4500% Price Surge Target
Following Bitcoin’s spot exchange-traded fund (ETF) approval on January 11, market speculation has grown around the possibility of similar investment vehicles for major cryptocurrencies, including a spot XRP ETF. However, certain requirements and regulatory considerations must be met before such a development can occur.
Regulatory Prerequisites For Spot XRP ETF
FOX reporter Eleanor Terret clarifies the matter, stating that launching an XRP spot ETF would first require the establishment of a futures ETF.
In the case of Bitcoin, the approval of spot ETFs was conditional upon the Securities and Exchange Commission (SEC) concluding that the Chicago Mercantile Exchange (CME) Bitcoin futures market provided sufficient surveillance against fraud and manipulation.
Terret suggests that for XRP to have a spot ETF, a futures ETF must first be established, marking a step in the right direction.
Bloomberg ETF expert James Seyffart shares a similar sentiment, stating that he does not anticipate an XRP ETF launching this year. Seyffart cites the ongoing SEC case against Ripple as a factor influencing his stance, suggesting that an XRP ETF is more likely to emerge once the regulatory matter is resolved.
Seyffart adds that XRP futures trading on a regulated platform like the Chicago Mercantile Exchange would be a prerequisite for the SEC to consider any applications for a spot XRP ETF. Seyffart hints that an XRP futures ETF could also be advantageous in this context.
The SEC has maintained a cautious approach towards spot ETFs involving crypto assets due to concerns about potential market manipulation. Seyffart emphasizes that the availability of XRP futures trading on a regulated platform, such as the CME, would provide a favorable framework for the SEC’s consideration of a spot XRP ETF, especially given previous court rulings highlighting the correlation between futures and spot markets.
Amidst the ongoing speculation, blockchain firm Ripple seems to be preparing for potential involvement in the ETF space.
A recent job advertisement posted on Ripple’s website reveals their search for a Senior Manager in business Development, with a focus on institutional decentralized finance (DeFi). The role includes spearheading cryptocurrency-related ETF initiatives with internal trading teams and relevant partners.
XRP’s Future Potential – From $0.5299 To $27?
Crypto market analyst EGRAG crypto has conducted a comprehensive price analysis of the XRP token. Despite peaking in 2023, when the price reached a high of $0.9376 on July 13, the token has retraced more than 15% since the start of 2024 to a current trading price of $0.5299.
However, according to EGRAG, the 21 Exponential Moving Average (EMA) on the monthly time frame is a significant indicator for assessing XRP’s price movement.
The analysis focuses on three price levels: $3.5, $6.5, and $27. Based on previous instances (labeled A, B, and C), EGRAG extrapolates potential future price movements using the same percentage increases observed in the past.
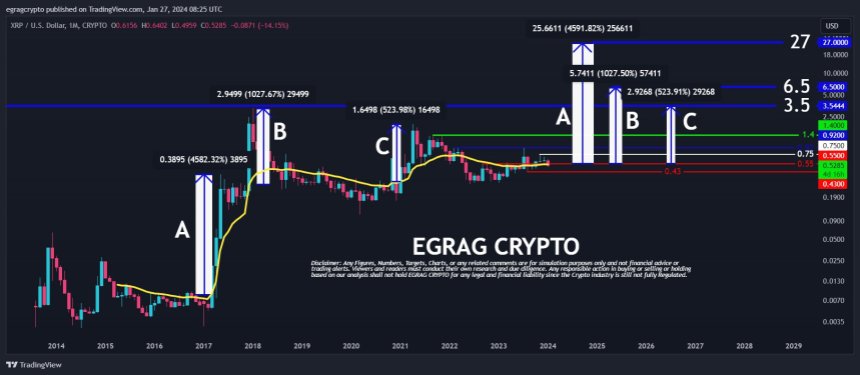
The first potential scenario is a significant price surge to $27, representing a massive 4500% increase. This prediction is based on a similar percentage move observed in the past (from previous instance A), seen in the chart above.
The second scenario suggests a more conservative projection, with XRP potentially experiencing a solid 1000% increase to $6.5. This projection is based on historical patterns observed in previous instance B.
In the third scenario, EGRAG anticipates a significant 500% rise in XRP’s price, reaching $3.5. Based on previous instance C, this projection indicates a significant upward movement for the token.
Whether the XRP token can successfully surpass the upper resistance levels that have impeded its rise to the $0.600 mark since late December remains to be seen.
Additionally, the market eagerly awaits a catalyst that could prompt a breakthrough in XRP’s seven-month downtrend structure, potentially resulting in a price surge above $0.700.
Featured image from Shutterstock, chart from TradingView.com
Disclaimer: The article is provided for educational purposes only. It does not represent the opinions of NewsBTC on whether to buy, sell or hold any investments and naturally investing carries risks. You are advised to conduct your own research before making any investment decisions. Use information provided on this website entirely at your own risk.
In the midst of Bitcoin’s recent price struggle, CryptoQuant head of research has revealed the level Bitcoin can potentially sink down to.
Bitcoin Might Go Down To As Low As Realized Price Of 1 To 3 Months Old Hands
In a new post on X, CryptoQuant Head of Research Julio Moreno has discussed how low the BTC price can go following the latest correction. “To evaluate this I like to look at the realized price of 1 to 3 month-old holders,” explains Moreno.
The “realized price” refers to an indicator that basically tells us about the average price at which investors in the Bitcoin market acquired their coins. This metric uses on-chain data to find the cost basis of holders, by assuming that the last transfer of any coin in circulation was when the coin changed hands.
When the spot price of the cryptocurrency is above the realized price, it means that the investors as a whole are carrying some unrealized gains currently. On the other hand, the price being lower than the metric suggests the overall market is underwater.
Naturally, when the realized price and spot price are exactly equal, the average investor in the sector could be assumed to be just breaking even on their investment.
In the context of the current topic, Moreno hasn’t applied the realized price to the entire user base but rather to just a segment of the investors: the 1-to 3-month-old holders.
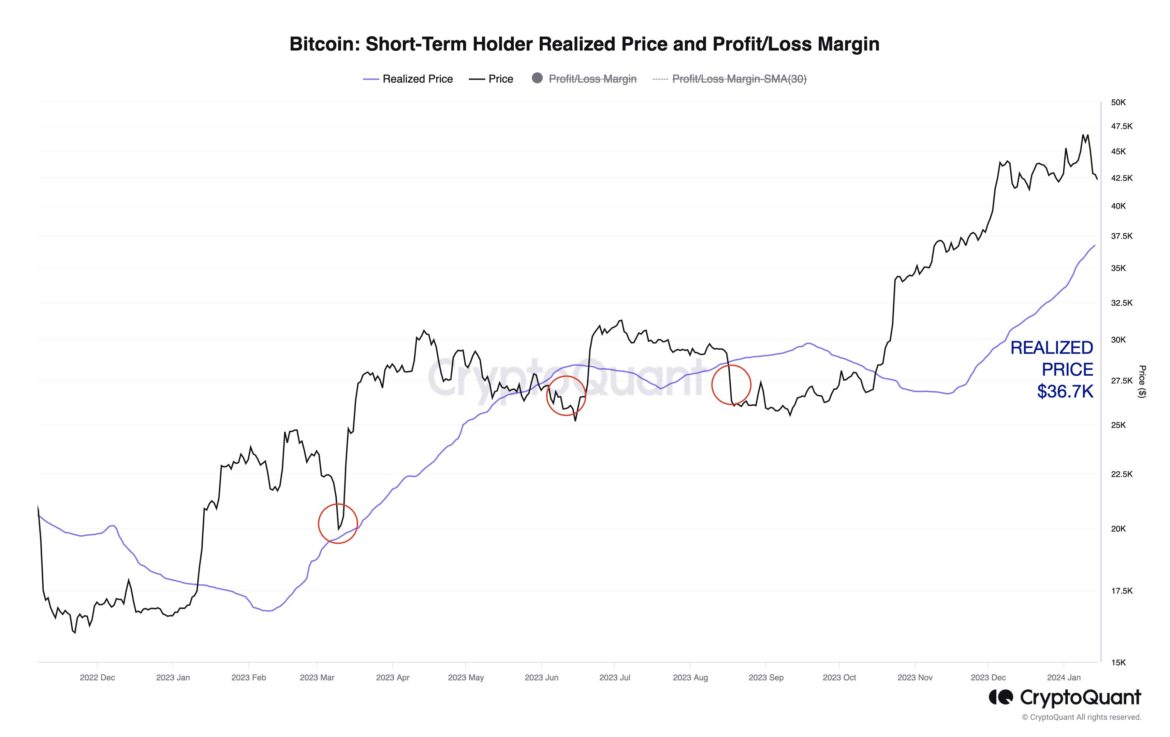
The below chart shows the trend in the Bitcoin realized price for this particular holder group over the last year:
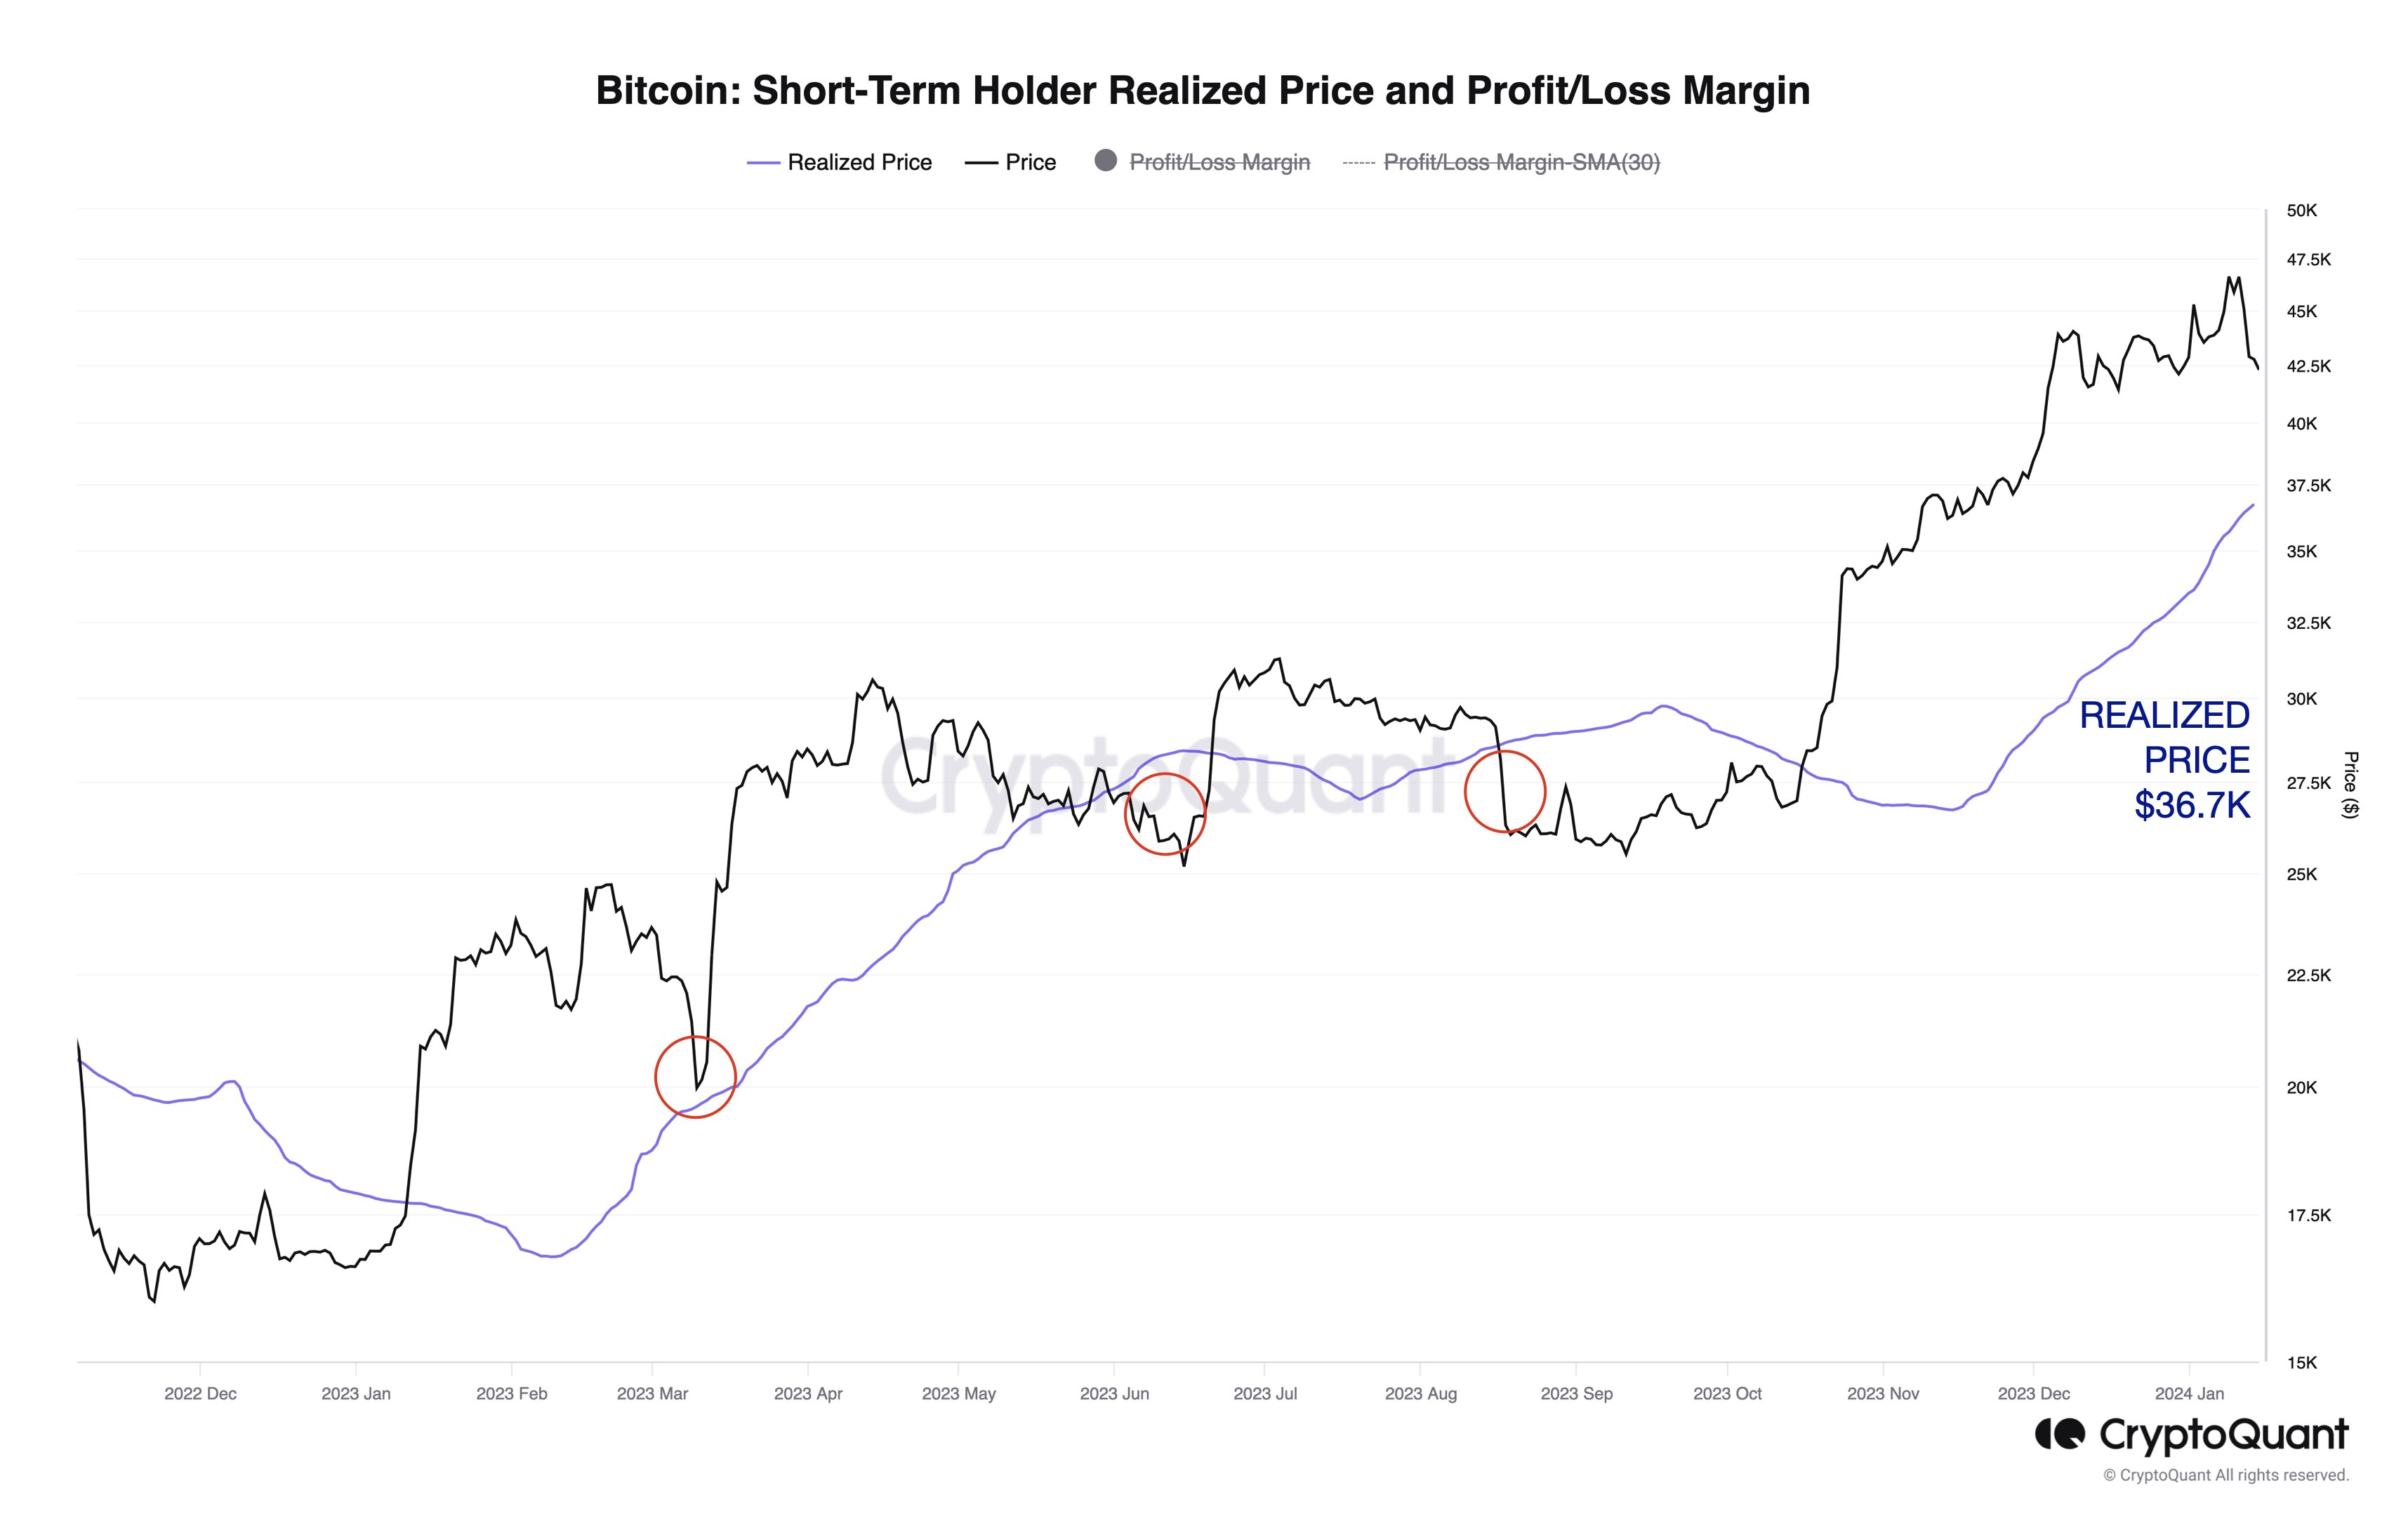
The trend in the realized price of this short-term holder segment | Source: jjcmoreno on X
The 1 to 3 months old investors make up a part of the wider “short-term holder” (STH) cohort. The STHs are defined as investors who bought their coins within the last 155 days.
Thus, the holders who bought between 1 and 3 months ago would be on the younger side of this group. Generally, the STHs behave in a fickle manner, reacting to any significant changes in the market, like a rally or crash.
The more mature a holder’s coins become, the less likely the investor turns to show any such reaction. Since the 1 to 3-month-old hands, although not the youngest, are still young STHs, they are likely to react to price changes.
According to Moreno, the realized price of these STHs has “represented a support level historically and during 2023.” The reason behind the level being supported is likely the fact that these investors would closely watch their average cost basis and move to buy more when the price dips around there if the general mood around the market is bullish.
In times when the prevailing Bitcoin trend is bearish, the level can act as resistance instead, as these STHs would be willing to exit the market at their break-even point.
At present, the realized price of the 1 to 3-month-old STHs is $36,700. Given the historical pattern, it’s possible Bitcoin might dip to around there before finding support, if the current correction continues for long.
BTC Price
Since the asset’s price plunged under the $45,000 level a few days back, the Bitcoin price has been trading sideways around the $42,500 level.
Looks like the price of the coin has been moving sideways recently | Source: BTCUSD on TradingView
Featured image from Shutterstock.com, charts from TradingView.com, CryptoQuant.com
Disclaimer: The article is provided for educational purposes only. It does not represent the opinions of NewsBTC on whether to buy, sell or hold any investments and naturally investing carries risks. You are advised to conduct your own research before making any investment decisions. Use information provided on this website entirely at your own risk.
Crypto Analyst Blasts $20,000 XRP Price Target, Reveals Why It’s Impossible
XRP YouTuber Moon Lambo has hit out at those who believe that the XRP price could be worth $20,000 in the future. The analyst believes that this price level is unattainable for the crypto token as he highlighted reasons why he holds this belief.
Why The XRP Price Cannot Rise To $20,000
In a video on his YouTube Channel, Moon Lambo explained that XRP’s market cap will need to run into quadrillions of dollars if it were to achieve that price level based on its current market cap. However, from his calculation, there is not enough money in the world for such an occurrence, as at least $100 trillion will need to flow into the XRP ecosystem for that to happen.
According to the YouTuber, there is a “0% chance” that this will happen. He dismissed any argument that some assets could be sold off to fund this amount of inflows into the XRP ecosystem. This is unlikely to happen as those assets will need to go to zero to get the amount of liquidity needed to get the XRP price to $20,000, Moon Lambo argued.
XRP being worth that amount would also mean the crypto token having a market cap worth over ten times more than the value of the US stock market. Moon Lambo says that it is “utter nonsense” to think that this will happen. He believes there is no way that XRP can be more valuable than all the foremost companies in the US put together.
He also alluded to arguments that XRP can attain this price by becoming the currency for the global reserve. He says that swapping out the dollar, which currently accounts for a huge chunk of the global reserve, won’t still see the crypto token get the required liquidity to hit $20,000.
XRP price at $0.63 | Source: XRPUSD on Tradingview.com
Enough Reason To Still Be Excited As An XRP Holder
Despite his stance, Moon Lambo is still bullish on the XRP price. He stated that the crypto token doesn’t need this “crazy hype nonsense” for one to be excited as an XRP holder. The crypto analyst believes that as far as XRP is widely adopted, there is enough money that can flow into it, which could cause its price to hit three digits.
Unlike a price prediction of $20,000, XRP’s price hitting three digits is still within the “realm of possibilities.” However, Moon Lambo doesn’t see that instantaneously happening as he says that it could take “many market cycles.” The good news is that anyone who has been in on XRP for some time is already well-positioned for such a multiplier effect.
Meanwhile, analysts who have in the past made such “impossible” price predictions of $20,000 were not spared in the crypto analyst’s rant. Moon Lambo mentioned that such people only make baseless claims and do not provide justification for such assertions.
He provided insight into why these analysts make such predictions as he suggested that they were doing this to get more audience. He remarked that he would probably get more subscribers if he jumped on this “bandwagon.” However, he has no intention to do that as he says it will be “intellectually dishonest” to do that.
Featured image from Tekedia, chart from Tradingview.com
Disclaimer: The article is provided for educational purposes only. It does not represent the opinions of NewsBTC on whether to buy, sell or hold any investments and naturally investing carries risks. You are advised to conduct your own research before making any investment decisions. Use information provided on this website entirely at your own risk.
An analyst has explained how Ethereum is retesting a breakout zone currently and that this might lead toward a price target of $3,500.
Ethereum Is Retesting The Breakout Line Of An Ascending Triangle
As pointed out by analyst Ali in a new post on X, Ethereum may be preparing for a further climb right now as it’s retesting the breakout zone of an ascending triangle.
An “ascending triangle” is a pattern in technical analysis that, as its name implies, resembles a triangle. The pattern involves a horizontal line made by connecting highs and a slant line that strings together higher lows.
When the price retests the upper, horizontal level, it could be probable to feel some resistance. On the other hand, a touch of the lower level could lead to the price rebounding back up.
A break out of either of these lines suggests a potential sustained continuation of the trend. Naturally, an escape out of the triangle towards the upside implies bullish momentum, while a fall under means bearish momentum.
Like the ascending triangle, there is also the “descending triangle,” which is a similar pattern except for the fact that the two levels are switched around (as the prevailing trend is towards the downside).
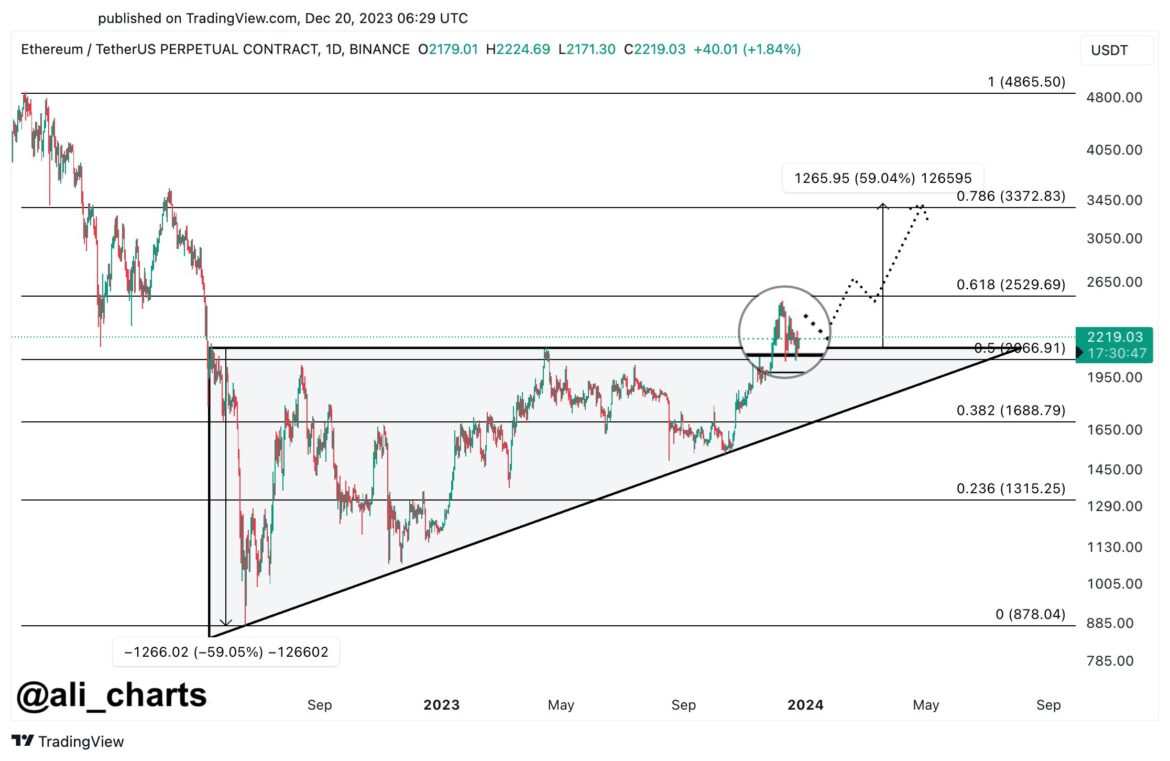
Now, here is the chart shared by Ali that displays how the price is interacting with an ascending triangle right now:
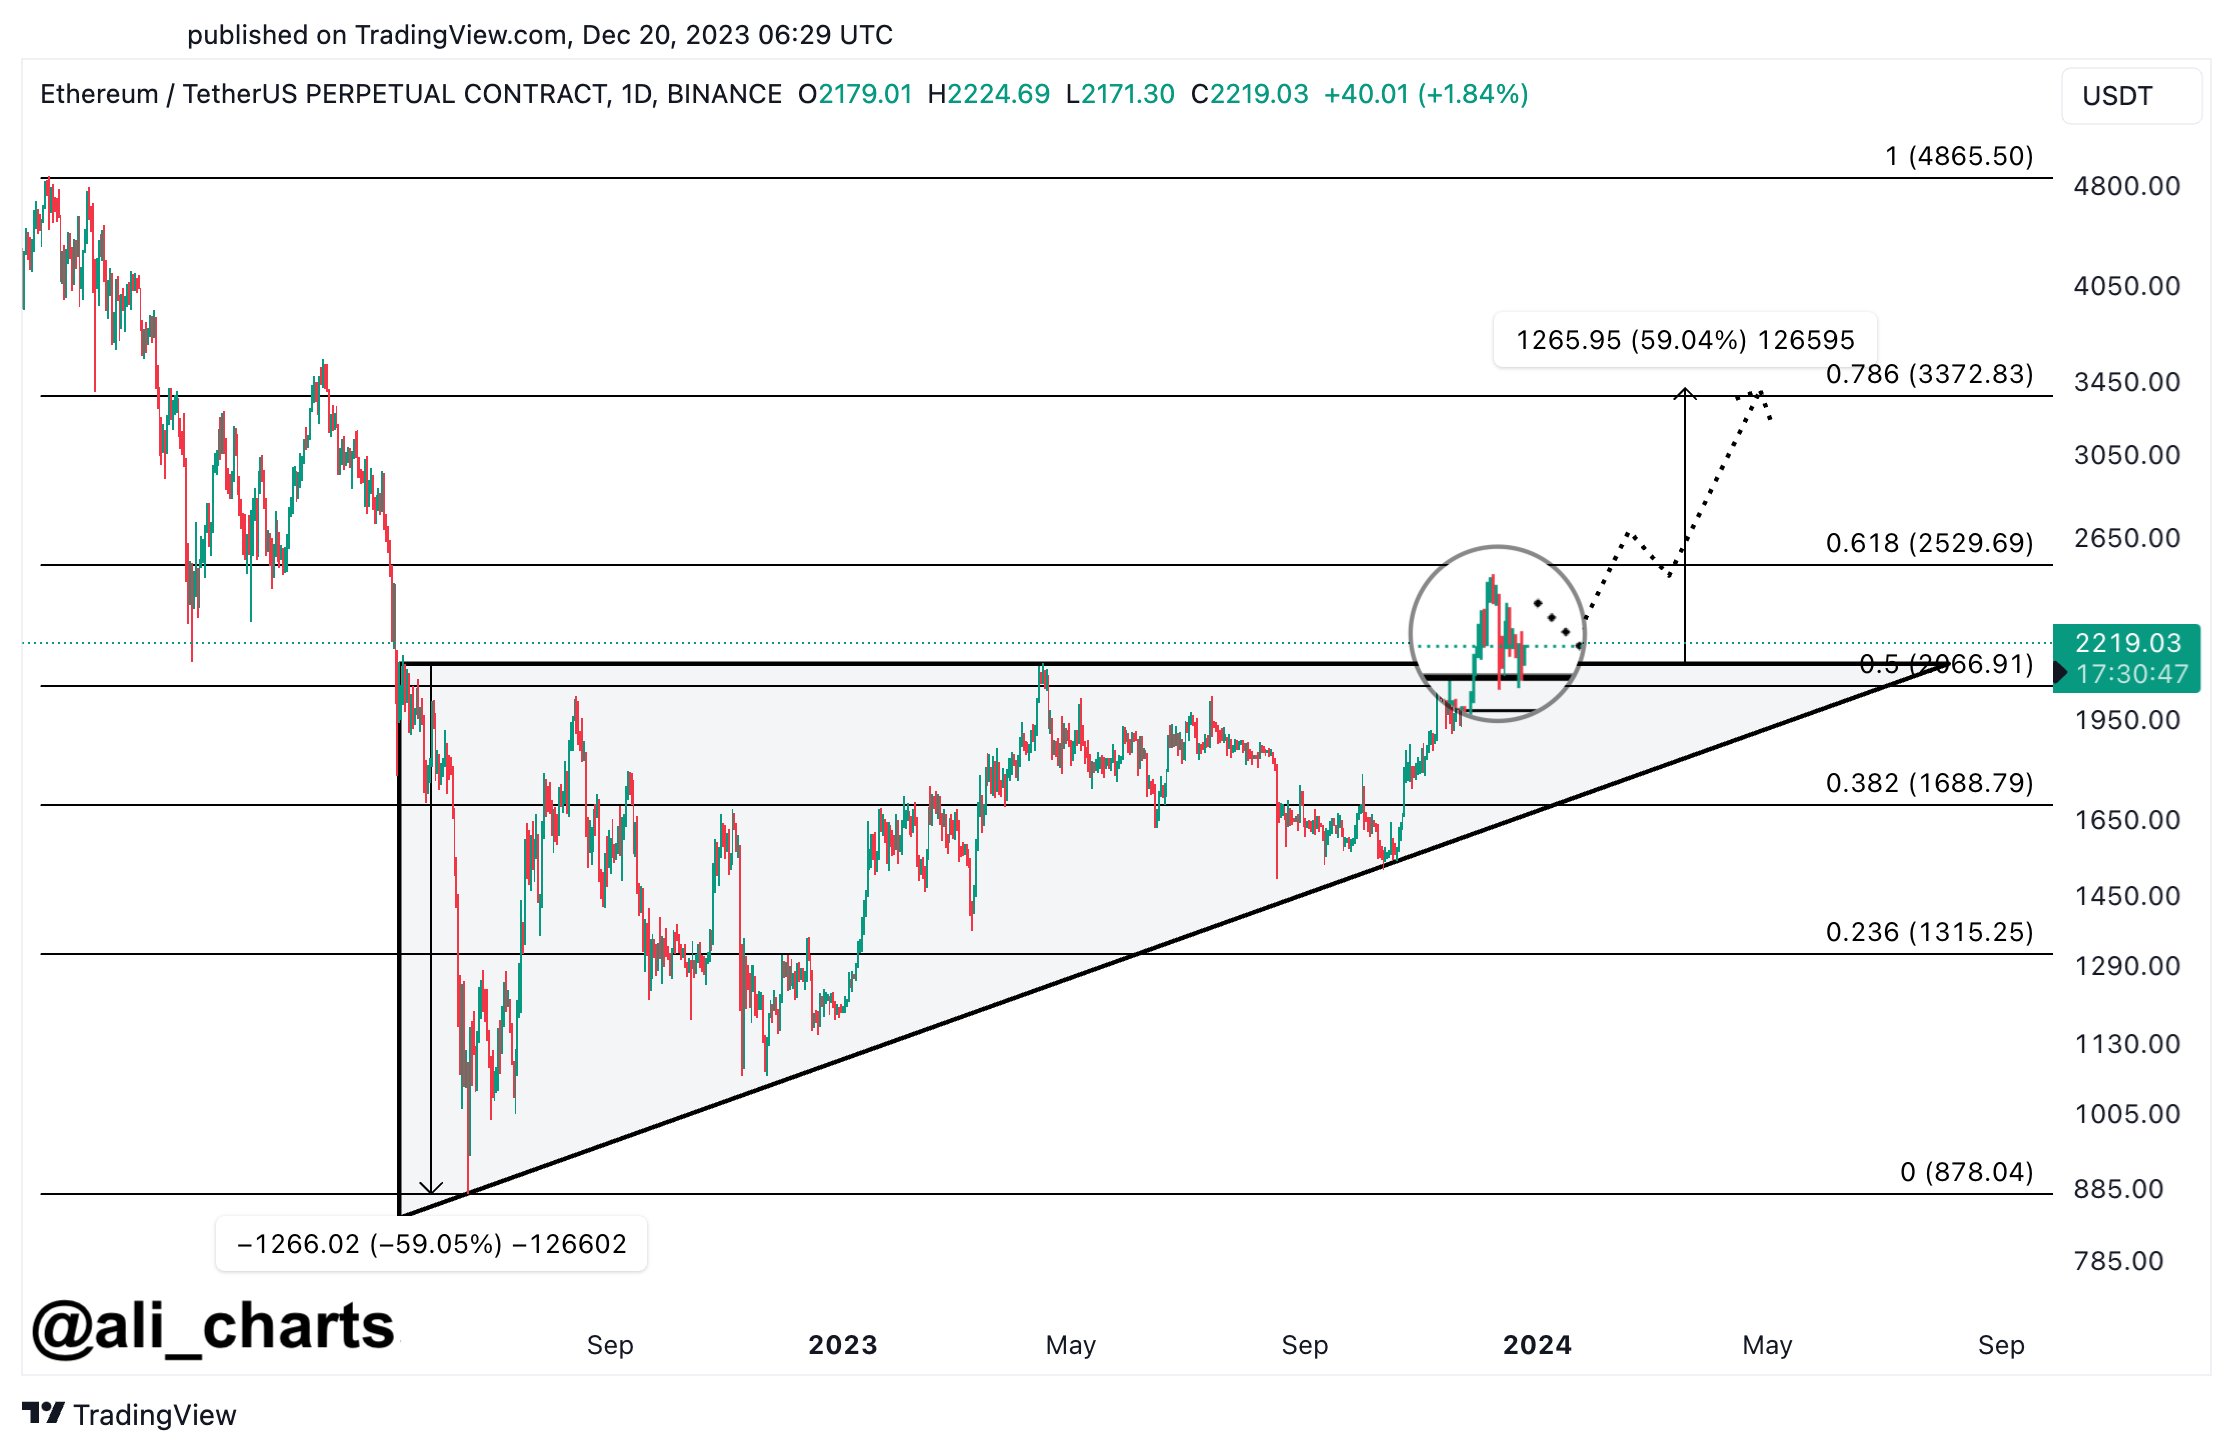
Looks like the asset's value has plunged back towards the triangle in recent days | Source: @ali_charts on X
As is visible in the graph, Ethereum found a bottom at the lower line of this ascending triangle pattern back in October. Following this low, the asset turned itself around with a sharp rally and went on to challenge the upper line.
The cryptocurrency succeeded in finding a break above the triangle and observed a continuation of the bullish momentum, exploring new highs for the year. Recently, though, the asset has slumped back again and has now fallen towards the triangle’s breakout line.
So far, the line has provided support to the asset, as its price has been able to remain above it. The analyst believes that this retest could be a sign that the coin is preparing for a further rally.
“The price range between $2,150 and $1,900 could be the ideal zone for accumulation before ETH sets its sights on a higher target of $3,500,” explains Ali. From the current price, such a target would mean a rally of almost 60% for the asset.
October, the month when Ethereum turned itself around off the triangle’s slope, was also an inflection point for the asset in terms of on-chain activity, as the analytics firm Glassnode has explained in its latest weekly report.
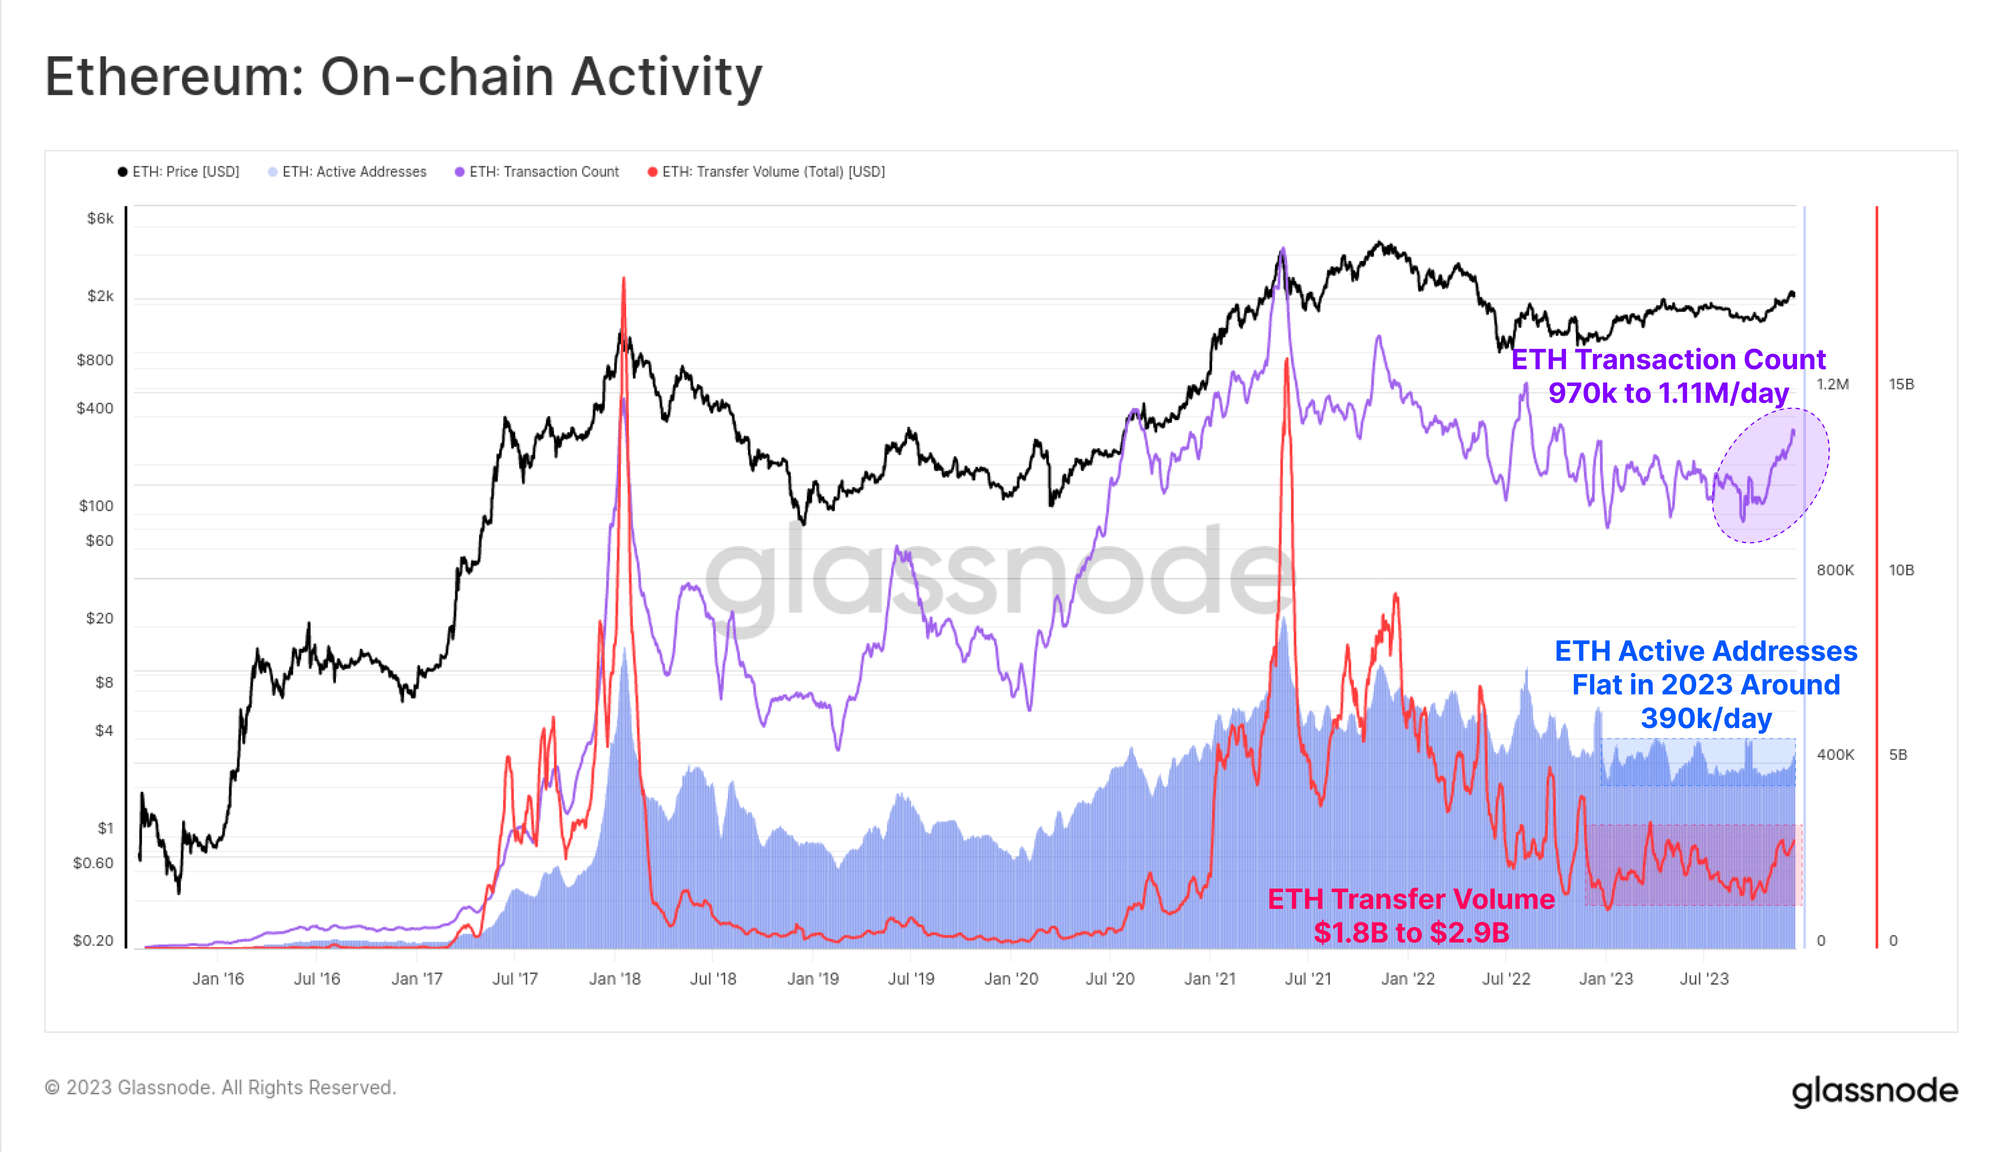
The trend in three on-chain indicators for ETH | Source: Glassnode's The Week Onchain - Week 51, 2023
From the chart, it’s visible that the Ethereum transaction count and transfer volume have both been trending up since the inflection point a couple of months back, which could be bullish for the price.
ETH Price
Ethereum has gone a bit stale recently as it has been consolidating around the $2,200 mark.
The price of the coin appears to have been moving sideways recently | Source: ETHUSD on TradingView
Featured image from Kanchanara on Unsplash.com, charts from TradingView.com, Glassnode.com
Disclaimer: The article is provided for educational purposes only. It does not represent the opinions of NewsBTC on whether to buy, sell or hold any investments and naturally investing carries risks. You are advised to conduct your own research before making any investment decisions. Use information provided on this website entirely at your own risk.


