 Data shows that U.S. spot bitcoin exchange-traded funds (ETFs) experienced negative outflows on Friday, totaling $55.1 million, with Grayscale’s Bitcoin Trust (GBTC) seeing another notable decrease. Metrics from Thursday reveal GBTC held 316,193.43 bitcoins, but after a decline of 2,048.23 bitcoins, the fund’s holdings reduced to 314,145.2 bitcoins. Blackrock and Fidelity Absorb Bitcoin Despite GBTC’s […]
Source link
Volatility
Nissan looks to address ‘extreme market volatility’ with 30 new models, EV cost cuts

Nissan is targeting an additional 1 million vehicle sales over the next three years and a 30% reduction in electric vehicle production costs by 2030, the Japanese carmaker announced Monday.
In a new medium-term business plan, Nissan also said it would launch 30 new models by fiscal 2026, with 16 of these electrified. It’s aiming for EV and combustion engine costs to reach parity by 2030.
“This plan will enable us to go further and faster in driving value and competitiveness,” Nissan President and CEO Makoto Uchida said in a statement.
“Faced with extreme market volatility, Nissan is taking decisive actions guided by the new plan to ensure sustainable growth and profitability.”
The automaker also said it is targeting an operating profit margin of more than 6% by the end of fiscal 2026, as well as “long-term profitable growth.”
‘A lot of uncertainty’
A Nissan Ariya electric car is on display during 2020 Beijing International Automotive Exhibition (Auto China 2020) at China International Exhibition Center on September 27, 2020 in Beijing, China.
Vcg | Visual China Group | Getty Images
To address this, Nissan plans to develop EVs in “families,” integrate powertrains and focus on battery innovations as it looks to cut the cost of its next-generation fleet by 30% when compared with the current model Ariya crossover.
“In order to do that, we have to have a great partnership with our suppliers to work on from the app stream earlier with the scale that we have to provide,” Uchida told CNBC’s “Squawk Box Europe.”
“Otherwise, I think the next five years, there’s a lot of uncertainty that we are facing. The scalability will be most important, and how are we going to make that as a Nissan collaboration with a partnership is going to be one of the key items.”
Nissan’s plan: The Arc
Under the two-part plan dubbed The Arc, Nissan said it will aim to ensure volume growth through a “tailored regional strategy,” and prepare for an accelerated EV transition by balancing its portfolio between EV and combustion cars, growing volumes in major markets, and financial discipline.
This will be supported by “smart partnerships, enhanced EV competitiveness, differentiated innovations and new revenue streams.”
Nissan said this strategy could yield potential revenues of 2.5 trillion yen ($16 billion) from new business opportunities by fiscal 2030.
Bitcoin sees violent volatility after hitting new ATH second time in a week
Bitcoin hit a new all-time high for the second time this week and once again experienced a violent sell-off that erased its gains and stirred memories of past volatilities in the crypto space.
Bitcoin broke its previous record early in the US trading hours on March 8, climbing to an all-time high of $70,136 after US jobs data raised expectations of rate cuts in the coming month.
However, the jubilation was short-lived as a wave of sell pressure engulfed the market, driving the price down by more than 3% to a low of $66,500 in less than an hour. The wider crypto market experienced similar volatility.
As of press time, BTC was trading at $67,890, according to CryptoSlate data.
Over the past four hours, the volatility caused $181.5 million in total liquidations, with longs making up more than $100 million. Meanwhile, Bitcoin liquidations during the period stood at $70.57 million, with longs accounting for $40.3 million, according to CoinGlass data.
The wall
This week’s market movements have been particularly turbulent, with Bitcoin’s value fluctuating widely. After setting a new record earlier in the week, BTC suffered a dramatic 14% drop, plummeting to around the $59,000 level before recovering.
Such volatility has become a defining characteristic of the crypto market, reflecting both the speculative nature of digital assets and the evolving landscape of financial markets.
Analysts identified a significant volume of sell orders on major exchanges, including Binance and OKX, as a pivotal factor in the rapid price reversal.
The sell orders, valued at roughly $70 million and totaling approximately 1000 BTC, created a formidable barrier that halted any further price increase beyond the $70,000 mark.
Institutional influence
Market analysts attribute the initial price surge to a combination of factors, including investor optimism regarding the US economic outlook and the introduction of spot Bitcoin exchange-traded funds (ETFs).
These developments have increasingly aligned crypto trading activity with traditional stock market hours, highlighting the growing integration of digital assets into conventional financial systems.
The backdrop to Bitcoin’s record-breaking rally was the latest US unemployment data, which suggested a potential easing of inflationary pressures and fueled speculation about the Federal Reserve’s interest rate policy.
The unexpected rise in the unemployment rate to 3.9%, coupled with downward revisions to job growth figures, has bolstered hopes for a more accommodative monetary stance.
As Bitcoin’s price ascension coincides with a weakening US dollar, the implications for the Fed’s upcoming policy decisions are being closely watched.
With the Fed’s next interest rate decision anticipated on March 20, market participants remain vigilant as the interplay between macroeconomic indicators and monetary policy could significantly influence the trajectory of Bitcoin and the wider digital assets market.
Bitcoin Market Data
At the time of press 5:39 pm UTC on Mar. 8, 2024, Bitcoin is ranked #1 by market cap and the price is up 1.19% over the past 24 hours. Bitcoin has a market capitalization of $1.35 trillion with a 24-hour trading volume of $53.2 billion. Learn more about Bitcoin ›
Crypto Market Summary
At the time of press 5:39 pm UTC on Mar. 8, 2024, the total crypto market is valued at at $2.59 trillion with a 24-hour volume of $148.59 billion. Bitcoin dominance is currently at 51.89%. Learn more about the crypto market ›
Mentioned in this article

Latest Alpha Market Report
Quick Take
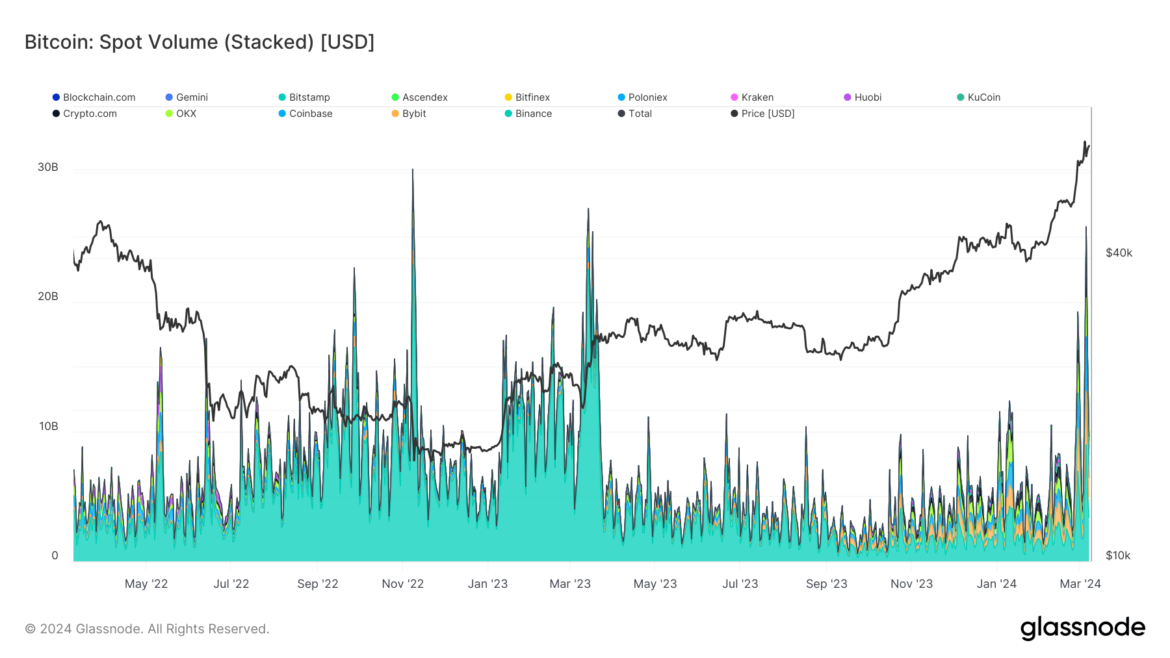
Recent Glassnode’s data captures intriguing shifts in Bitcoin’s spot volume, tracking the aggregate trading volume of Bitcoin against USD-based currencies, both fiat and stablecoin, across various exchanges. On March 5, there was a surge in spot volume to $26 billion across all exchanges, a pinnacle not reached since the SVB collapse in March 2023.
During the SVB collapse, Binance dominated the spot volume, contributing $22 billion of the total $27 billion, as reported by Glassnode. Now, spot volume has again reached a similar level, spurred by Bitcoin’s surge to a record $69,000 and its subsequent 15% drop. In this latest bout of volatility, the exchange landscape was more distributed, with Binance, Coinbase, and Bybit recording spot volumes of $9 billion, $4 billion, and $4 billion, respectively.
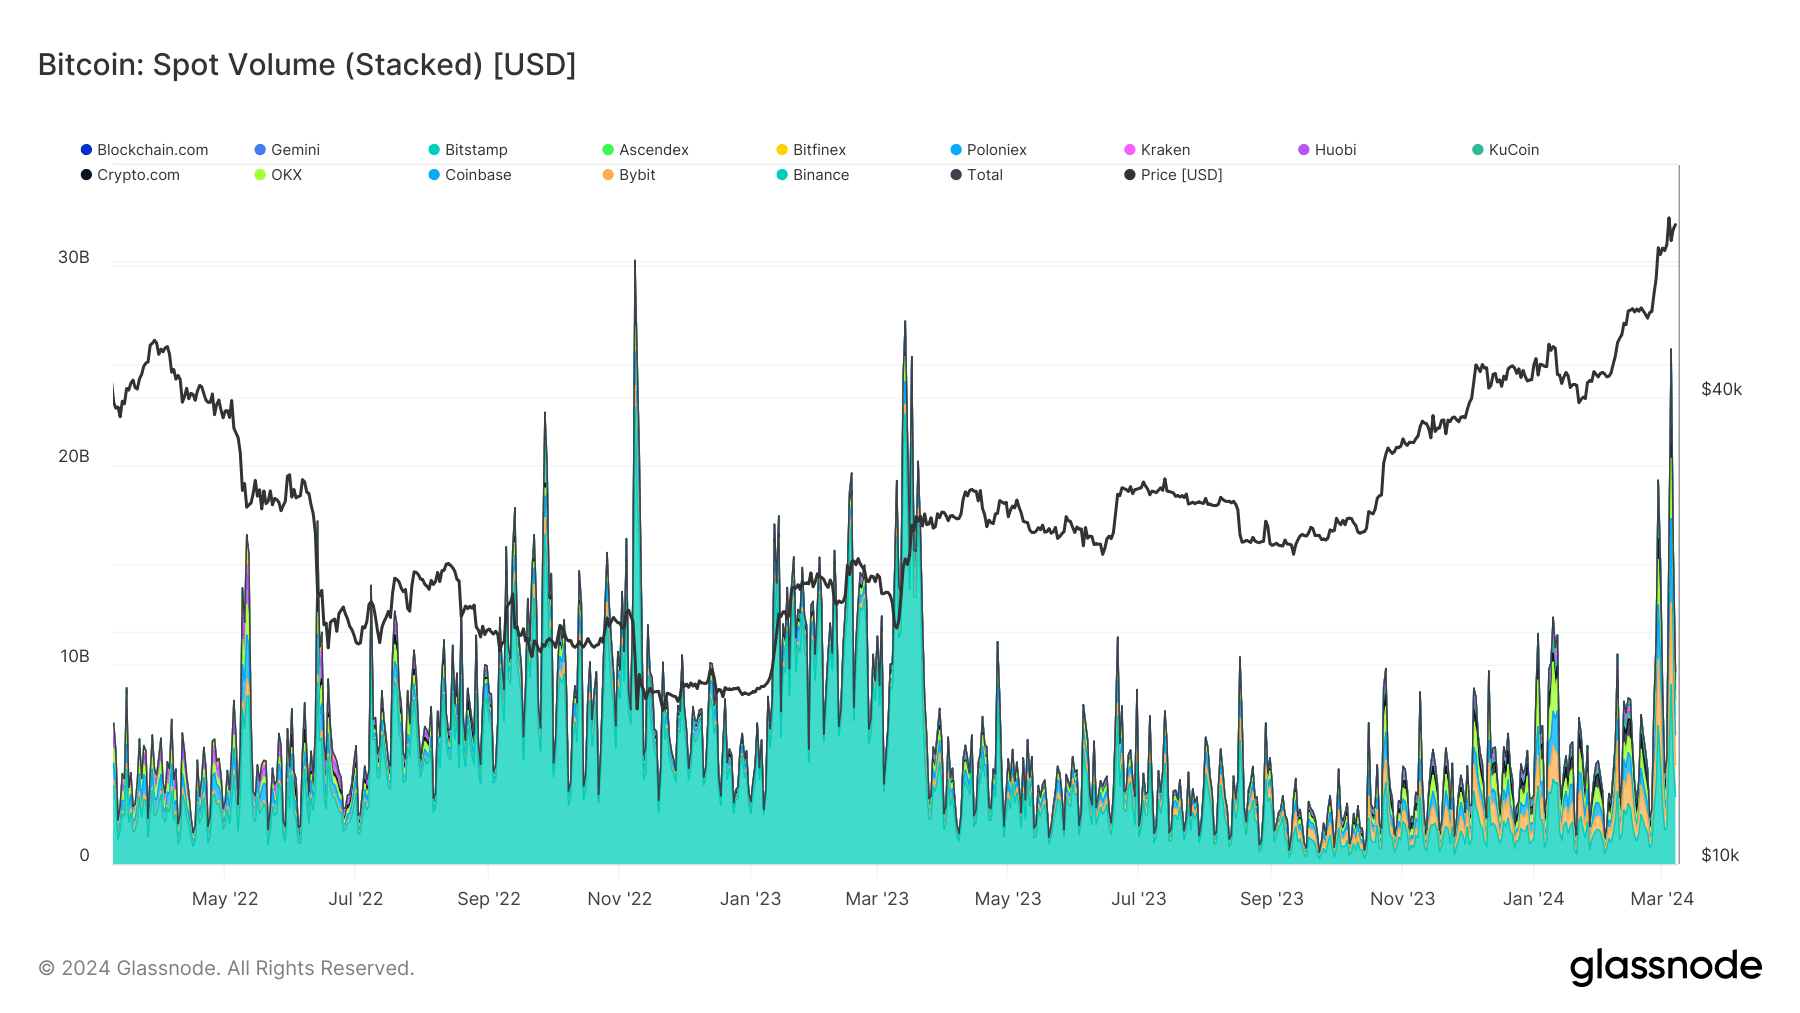
The data depicts a stark decrease in Binance’s market share over the year, as its spot volume shrank from $22 billion during the SVB event to $9 billion in the following year’s volatility peak.
The post High volatility drives spot Bitcoin volume to $26 billion appeared first on CryptoSlate.
Data shows the cryptocurrency futures market has seen liquidations amounting to $700 million in the past day as Bitcoin has gone through its volatility.
Bitcoin Has Seen Intense Price Action In Past 24 Hours
The past day has been a bit of a rollercoaster for Bitcoin, with the asset registering sharp price action in both directions but ultimately going up as the bulls win out.
The chart below shows what the price action for the cryptocurrency has looked like recently.
The price of the asset seems to have enjoyed sharp bullish momentum recently | Source: BTCUSD on TradingView
From the graph, it’s visible that Bitcoin initially witnessed some sharp bullish momentum, in which the coin not only broke above the $60,000 level, but went up to touch the $64,000 mark.
This high, which is the peak for the year so far, only lasted briefly, however, as BTC crashed down spectacularly to under the $59,000 mark. The asset has since recovered to higher levels, now floating around $62,700.
The rest of the cryptocurrency sector has also gone through its volatility, with prices fluctuating across the coins. As is usually the case with such sharp price action, the futures market has suffered many liquidations.
Crypto Futures Market Has Gone Through A Squeeze In The Past Day
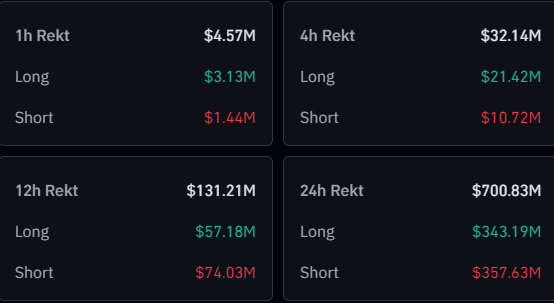
According to data from CoinGlass, the cryptocurrency futures market has witnessed the liquidation of contracts worth more than $700 million in the last 24 hours.
The table below displays the relevant information about the liquidations.
A massive amount of liquidations appear to have occurred in the past day | Source: CoinGlass
It would appear that only $131 million of the liquidations came within twelve hours, suggesting that most of the flush was situated inside the preceding half-day period. This makes sense, as Bitcoin was most volatile inside this window.
It also seems that the long-to-short ratio in this liquidation event has been quite balanced, even though the price has increased in the past day. This would suggest that some aggressive longing occurred as Bitcoin approached $64,000, and the subsequent pullback wiped these top buyers.
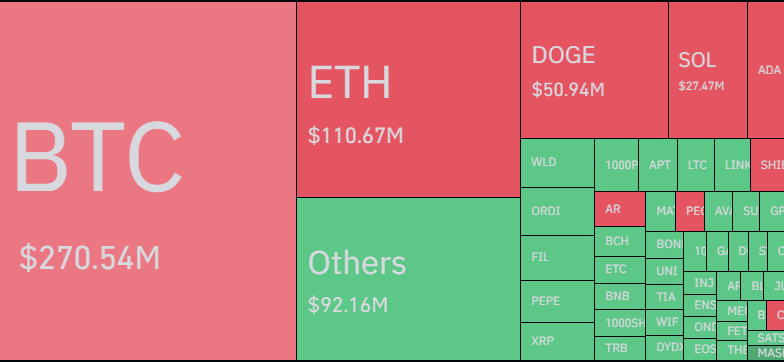
The table below shows how the distribution has looked for the various symbols.
Looks like BTC has topped the charts once more | Source: CoinGlass
As is generally the case, Bitcoin futures contracts have again been responsible for the largest portion of the total market liquidations, contributing around $270 million.
What’s different this time, however, is that this share, although the largest, isn’t even half the total liquidations. This could come down to the fact that speculators may now be playing around with altcoin positions after gaining confidence from the BTC price surge.
Dogecoin, the best performer among the top coins with its 34% jump, has occupied the largest share among the alts, with almost $51 million in liquidations.
Featured image from André François McKenzie on Unsplash.com, CoinGlass.com, chart from TradingView.com
Disclaimer: The article is provided for educational purposes only. It does not represent the opinions of NewsBTC on whether to buy, sell or hold any investments and naturally investing carries risks. You are advised to conduct your own research before making any investment decisions. Use information provided on this website entirely at your own risk.
Bitcoin’s supply in profit shows bullish sentiment despite volatility
Monitoring the percentage of Bitcoin’s supply in profit offers crucial insights into market trends and potential movements. This metric calculates the proportion of existing Bitcoins currently held at a value higher than their purchase price. Its significance lies in providing a snapshot of overall market profitability, revealing whether most holders are in a state of gain or loss. Spikes in this metric often correlate with market optimism, while drops can indicate increasing pressure to sell, often preceding market downturns.
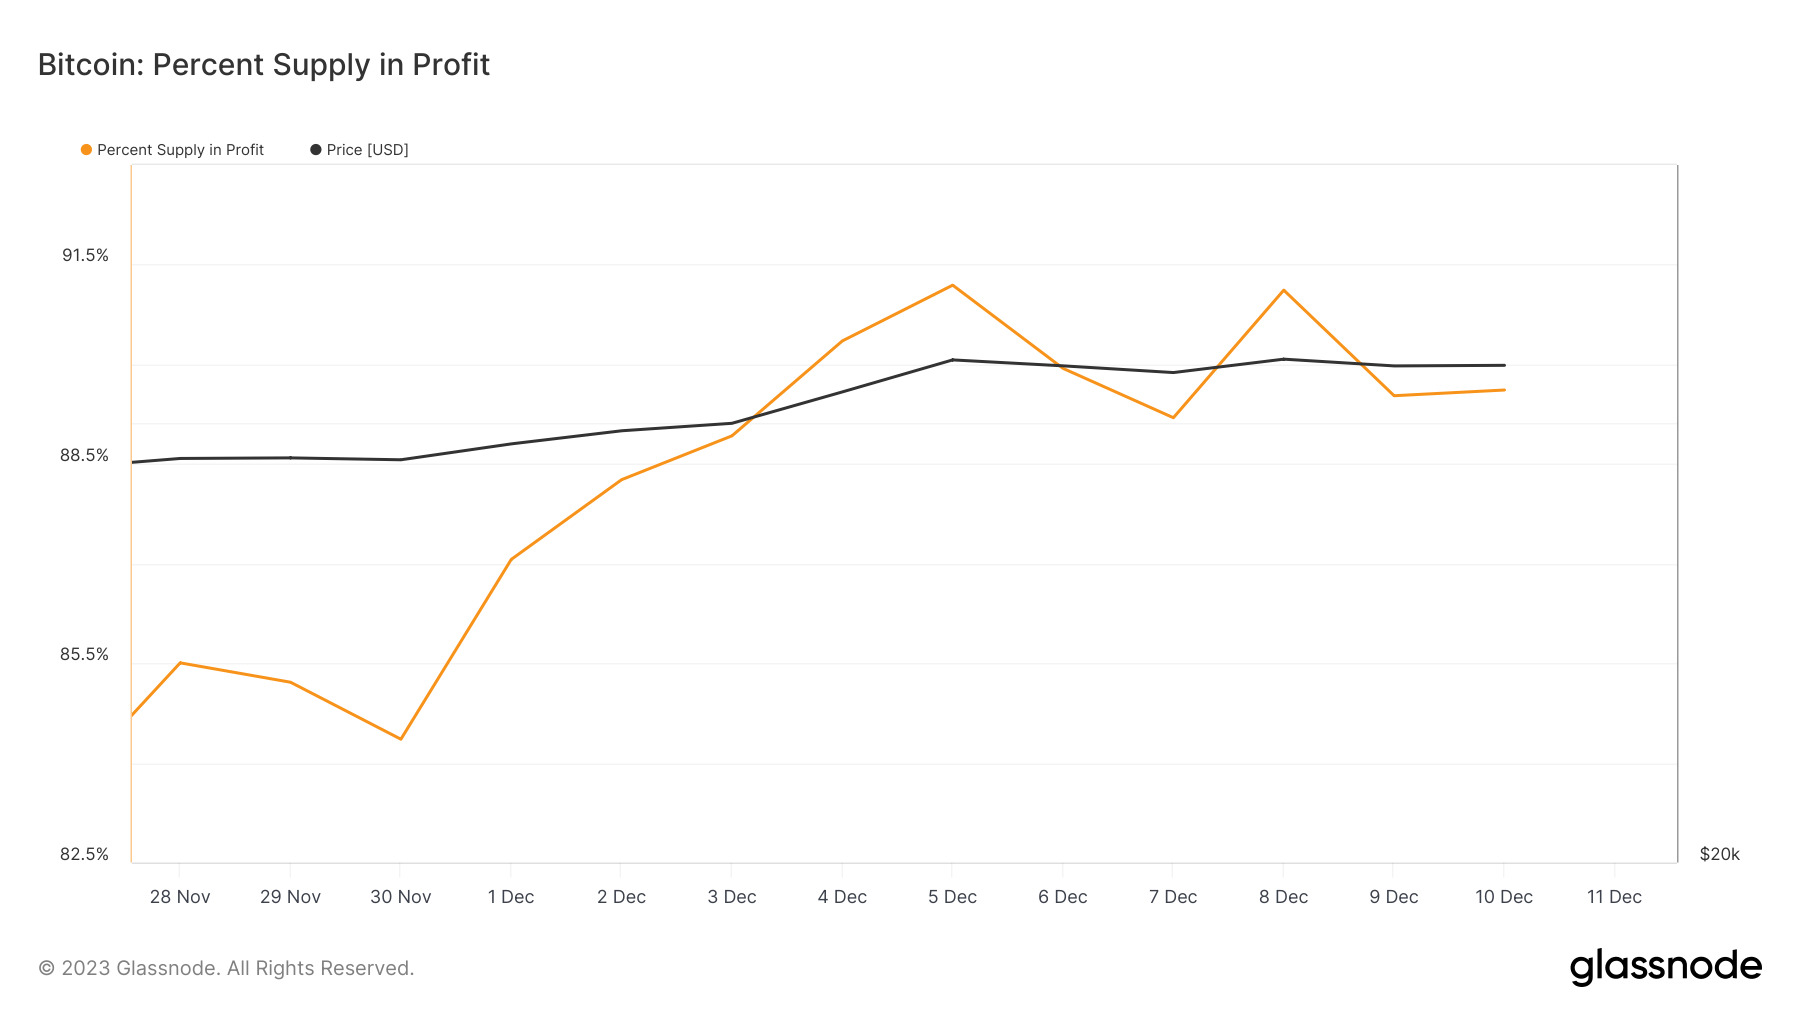
On Dec. 8, 2023, a crucial market milestone was achieved as Bitcoin’s supply in profit exceeded 91.1%, with its price surging over $44,000. This marked a momentous phase of market prosperity unseen since early November 2021. Such a high percentage of Bitcoin in profit typically signals a widespread bullish sentiment, as most investors hold assets at a value exceeding their initial investment.
However, this peak was followed by a swift correction over the weekend, with Bitcoin’s price retreating below $42,000. This shift resulted in the supply in profit dwindling to 89.6%, illustrating a substantial profit-taking event in the market. This reduction suggests that traders, possibly anticipating a more dramatic decline, were keen to secure their gains. Such behavior often indicates a market poised at a critical juncture, with investors wary of a potential fall below pivotal psychological levels like $40,000.
While raw data on Bitcoin’s supply in profit provides immediate insights, it can often be misleading due to its susceptibility to daily market fluctuations. To garner a more accurate and long-term perspective, analyzing the 50-day moving average (MA) of this metric is more instructive. The 50-day MA smooths out short-term volatility, offering a clearer picture of underlying market trends. When the percentage of Bitcoin’s supply in profit consistently hovers above this average, it generally reflects a bullish market sentiment. Conversely, persistently low figures below the MA can hint at bearish trends.
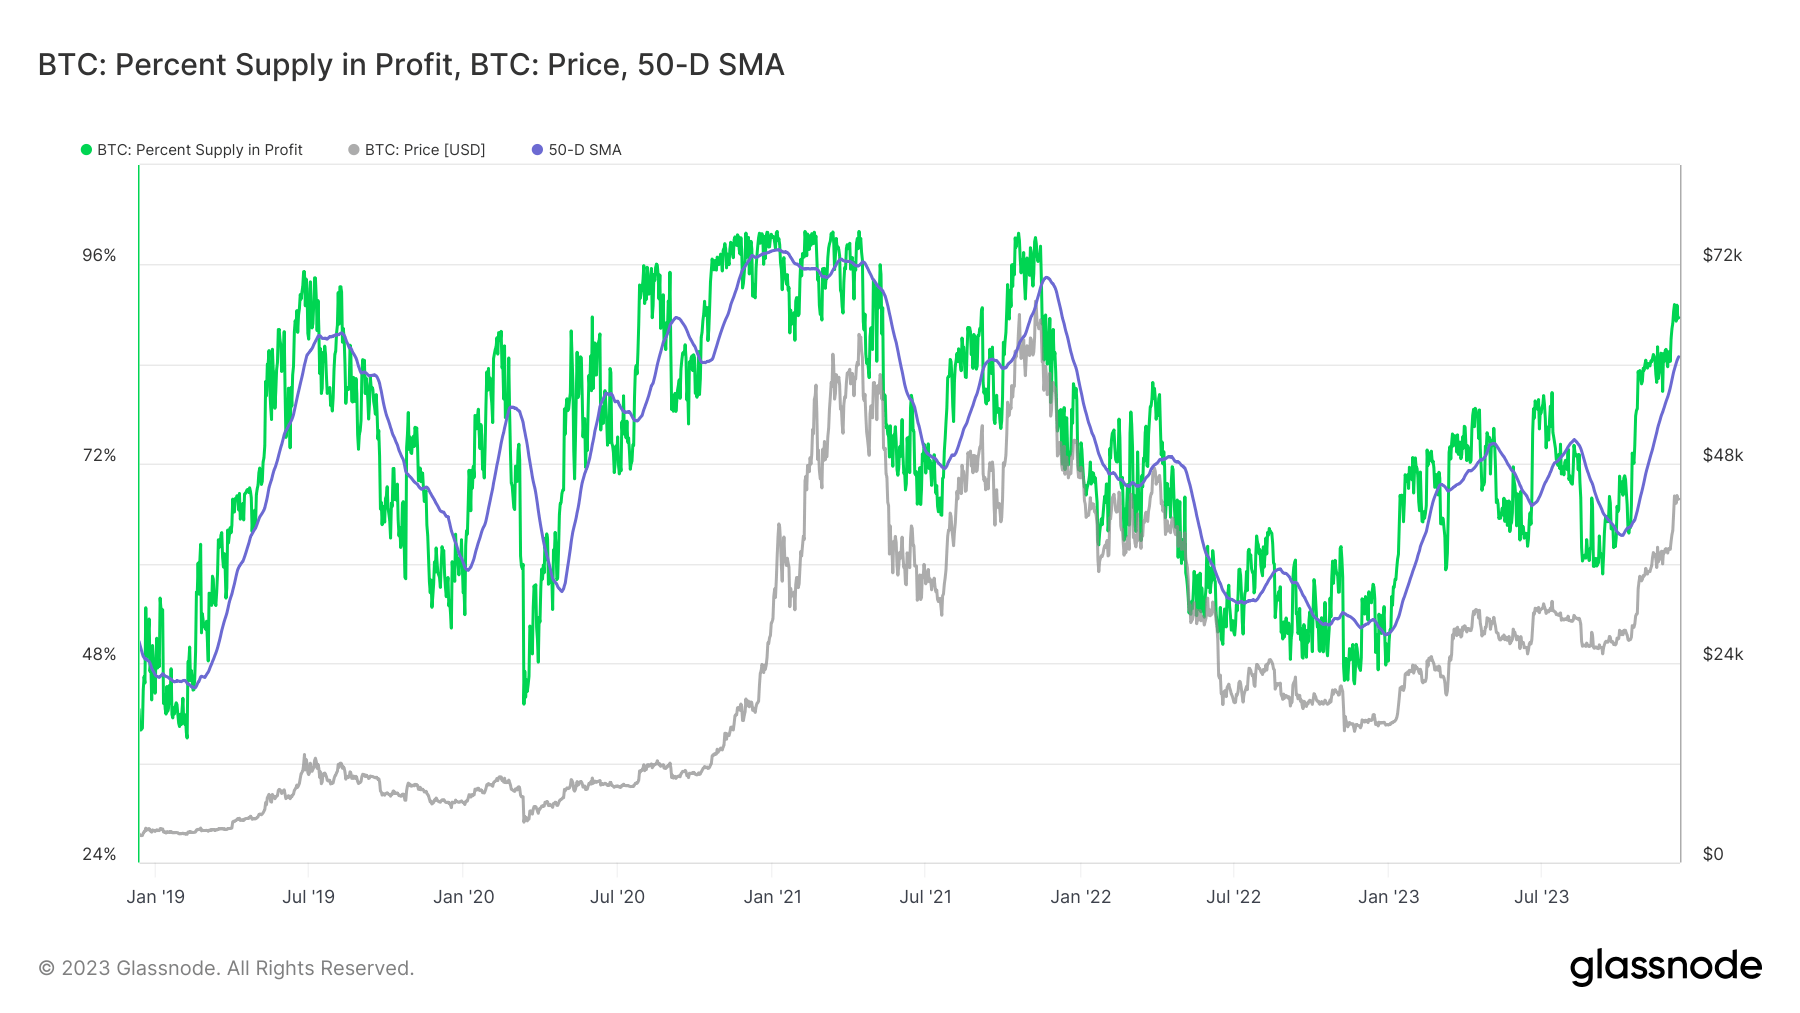
Since early October, the 50-day MA for Bitcoin’s supply in profit has witnessed a marked increase. It rebounded from a low of 63.3% in early October to 84.91% by Dec. 11, after a decline from 74.9% in early August. Notably, the supply in profit has remained above its 50-day MA since Oct. 14, underscoring a sustained bullish outlook among investors.
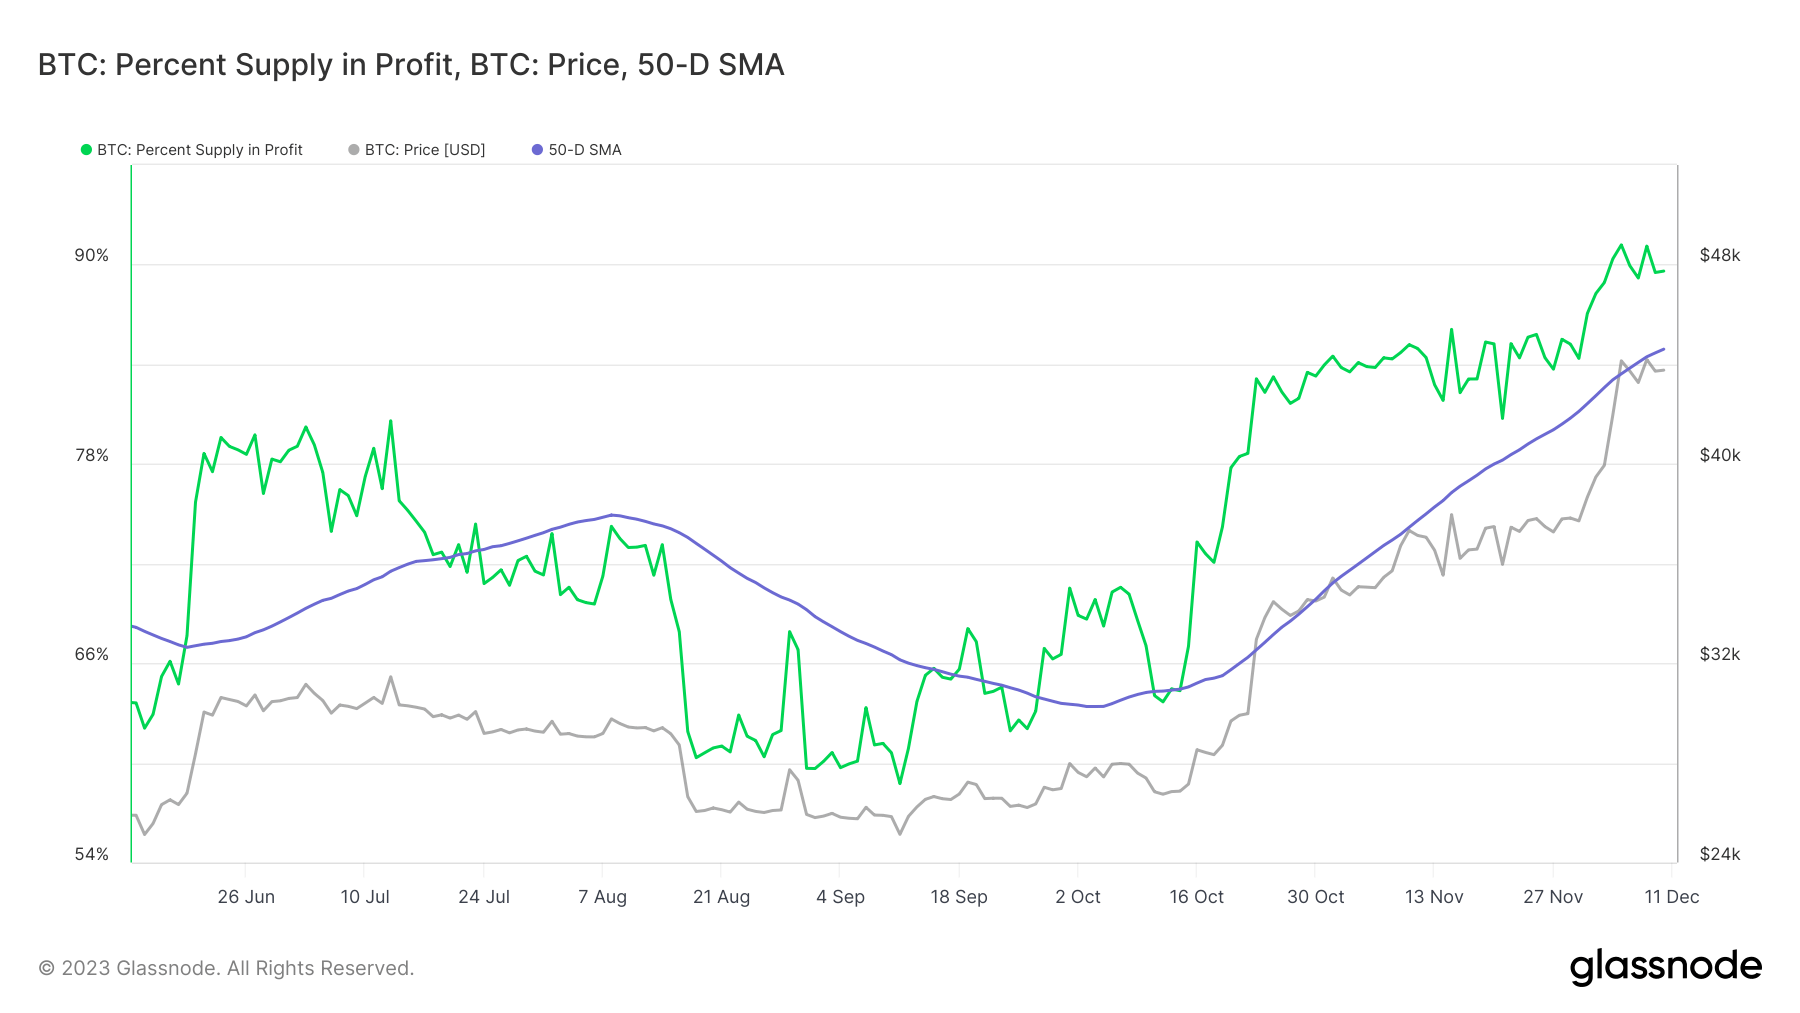
This persistent elevation above the 50-day MA is a strong indicator of market confidence. It suggests that the overarching sentiment remains positive despite short-term corrections and volatility. Investors are seemingly unfazed by temporary downturns, maintaining their holdings in anticipation of future gains.
The post Bitcoin’s supply in profit shows bullish sentiment despite volatility appeared first on CryptoSlate.
Heightened rate volatility points to these opportunities in stocks, bonds for ETF investors, says State Street’s Michael Arone
Hello! For this week’s ETF Wrap, I spoke to Michael Arone, chief investment strategist for the U.S. SPDR business at State Street Global Advisors, for his view of markets and where ETF investors may look for opportunities at this stage of the Federal Reserve’s interest rate-hiking cycle.
Please send feedback and tips to christine.idzelis@marketwatch.com or isabel.wang@marketwatch.com. You can also follow me on X at @cidzelis and find me on LinkedIn. Isabel Wang is at @Isabelxwang.
Sign up here for our weekly ETF Wrap.
Bond-market volatility spilling into stocks in 2023 may also be creating investment opportunities that could pay off in the next year, according to Michael Arone, chief investment strategist for the U.S. SPDR business at State Street Global Advisors.
“When interest rates have this great of impact on the stock market, historically, going forward it’s been a positive sign for stocks,” he said in a phone interview.
Investors may see over the next 12 months a broadening in the participation of in any stock market rally, with a potential recession in that period likely to be short and shallow, according to Arone. He said “the stock market may not be impacted for very long” by such a downturn.
Small-cap and value stocks stand to see some of the biggest gains, said Arone. That’s based on past periods when interest rate volatility rocked markets and similarly led to high dispersion in equities, he said.
The U.S. stock market is being driven by a small group of Big Tech stocks this year, while small-cap companies have lagged and large-cap growth equities have broadly crushed value.
The SPDR Portfolio S&P 600 Small Cap ETF
SPSM
is down more than 4% this year based on Thursday afternoon trading, while the SPDR S&P 500 ETF Trust
SPY
has jumped more than 13%, FactSet data show.
As for value versus growth, the almost 19% surge for the SPDR Portfolio S&P 500 Growth ETF
SPYG
in 2023 has far surpassed the 7.6% gain of the SPDR Portfolio S&P 500 Value ETF
SPYV
based on Thursday afternoon.
Some Big Tech stocks, which include Apple Inc.
AAPL,
Microsoft Corp.
MSFT,
Google parent Alphabet Inc.
GOOGL,
Amazon.com Inc.
AMZN,
Nvidia Corp.
NVDA,
Facebook parent Meta Platforms Inc.
META,
and Tesla Inc.
TSLA,
appear in the top holdings of both the value and growth ETFs.
The largest three weights for the SPDR Portfolio S&P 500 Value ETF were Microsoft, Meta and Amazon as of Nov. 8, according to a list of the fund’s top holdings on State Street’s website. The ETF’s next largest holdings were Berkshire Hathaway Inc.
BRK.B,
JPMorgan Chase & Co.
JPM,
Walmart Inc.
WMT,
and Cisco Systems Inc.
CSCO,
The SPDR Portfolio S&P 500 Growth ETF’s top 10 holdings on Nov. 8 included all the Big Tech stocks except Meta, data on State Street’s website show.
Rising yields in the U.S. Treasury market in recent months hurt stocks, with the S&P 500’s three straight months of declines through October paring its 2023 gains. So far in November, though, Treasury yields have retreated and the S&P 500 has climbed.
Bond market yield moves have had an “exaggerated” impact on the U.S. stock market, said Arone.
The S&P 500 closed Wednesday with an eighth straight day of gains that marked its longest winning streak since November 2021, according to Dow Jones Market Data. The index
SPX
finished lower Thursday though to snap that stretch of gains as Treasury bond yields rose.
The bond market is volatile this year as the Federal Reserve keeps its benchmark interest rate elevated, after slowing its aggressive pace of hikes aimed at bringing down inflation to its 2% target.
The market is anticipating that the combination of the Fed potentially concluding its hiking cycle, falling inflation and a slowing economy will put downward pressure on rates, said Arone.
Long-term Treasurys pare big losses
Rising yields this year have led to steep losses in long-term Treasurys, with investors questioning whether now may be a good time to buy them.
The Vanguard Long-Term Treasury ETF
VGLT
was down 12.5% on a total return basis through October, but as yields declined this month the fund trimmed its year-to-date losses to 8.5% as of Thursday afternoon, according to FactSet data. Bond prices and yields move in opposite directions.
Investors have been trying to discern how long the Fed might keep rates elevated and then eventually begin cutting rates, on the expectation that such a shift in monetary policy would spur a price rally in long-term bonds.
Fed-funds futures points to traders anticipating the Fed may start lowering its benchmark rate in 2024, the CME FedWatch Tool shows.
Arone said one risk to his view that small-cap and value equities could drive a broadening in the stock-market rally is a deeper recession than he is now anticipating. A rise in real interest rates is another risk, he said.
See: Fed maintains freeze on interest rates as it fine-tunes fight against inflation
Short-term Treasury maturities remain the most attractive part of the yield curve with low volatility, but investors may also consider moving into intermediate-term investment-grade corporate credit in order to capture any rally from potential Fed rate cuts, according to Arone.
He said that strategy could involve holding the SPDR Bloomberg 1-3 Month T-Bill ETF
BIL
as well as the SPDR Portfolio Intermediate Term Corporate Bond ETF
SPIB.
Ultra-short-term T-bills are still “a good idea,” but taking on “a little bit” of credit risk may set investors up to benefit from price appreciation should the Fed finish tightening its policy and rates fall, according to Arone.
The SPDR Bloomberg 1-3 Month T-Bill ETF returned a total 4.2% this year as of Thursday afternoon, compared with a 1.8% total return for the SPDR Portfolio Intermediate Term Corporate Bond ETF over the same period, FactSet data show.
Read: Short-term bonds dominate fixed-income ETF flows again in October — with a single fund getting outsize portion of investors’ money
As usual, here’s your look at the top- and bottom-performing ETFs over the past week through Wednesday, according to FactSet data.
The good…
| Top Performers | %Performance |
|
Invesco China Technology ETF CQQQ |
6.4 |
|
ARK Innovation ETF ARKK |
5.4 |
|
ARK Next Generation Internet ETF ARKW |
5.1 |
|
VanEck Vietnam ETF VNM |
5.1 |
|
ARK Fintech Innovation ETF ARKF |
5.1 |
| Source: FactSet data through Wednesday, Nov. 8. Start date Nov. 2. Excludes ETNs and leveraged products. Includes NYSE, Nasdaq and Cboe traded ETFs of $500 million or greater |
…and the bad
| Bottom Performers | %Performance |
|
United States Natural Gas Fund LP UNG |
-10.3 |
|
First Trust Natural Gas ETF FCG |
-8.3 |
|
SPDR S&P Oil & Gas Exploration & Production ETF XOP |
-8.1 |
|
United States Oil Fund LP USO |
-7.9 |
|
iShares U.S. Oil & Gas Exploration & Production ETF IEO |
-7.0 |
| Source: FactSet |
New ETFs
- Avantis Investors announced on Thursday the launch of the Avantis U.S. Mid Cap Equity ETF AVMC, Avantis U.S. Mid Cap Value ETF AVMV and Avantis Emerging Markets Small Cap Equity ETF AVEE.
- Janus Henderson Investors said Thursday that it launched the Janus Henderson Securitized Income ETF JSI, an actively managed fund that expects to invest in areas including asset-backed securities, commercial mortgage-backed securities, collateralized loan obligations, mortgage credit and agency mortgage-backed securities.
-
Simplify Asset Management said Nov. 7 that it launched the Simplify MBS ETF
MTBA,
which will seek to invest in mortgage-backed securities that provide “attractive” yields versus comparable U.S. Treasuries while carrying “little” credit risk. -
The Bahnsen Group said Nov. 7 that it launched the TBG Dividend Focus ETF
TBG,
which aims to invest in publicly traded companies with “a long history of growing their dividend.”
Weekly ETF reads
Long-term Treasury yields drop for fifth time in six sessions after period of volatility
Two- through 30-year Treasury yields finished lower on Tuesday as the market looked to settle following a period of volatility.
What happened
-
The yield on the 2-year Treasury
BX:TMUBMUSD02Y
fell 2.4 basis points to 4.915% from 4.939% on Monday. -
The yield on the 10-year Treasury
BX:TMUBMUSD10Y
retreated 9.2 basis points to 4.570% from 4.662% Monday afternoon. -
The yield on the 30-year Treasury
BX:TMUBMUSD30Y
dropped 9.7 basis points to 4.734% from 4.831% late Monday. - 10- and 30-year rates have each fallen five of the past six trading sessions, according to 3 p.m. Eastern time figures from Dow Jones Market Data.
What drove markets
The Treasury market strove for stability on Tuesday after volatility in recent sessions. Hopes that the Federal Reserve may be done with increasing interest rates has caused the benchmark 10-year yield to drop from a cycle high of around 5% to its current level near 4.6% in just a few weeks.
Read: The Fed wanted the bond market’s help in fighting inflation. Is it backfiring?
A reminder for investors that central banks could readily revive rate hikes if inflation proves sticky came from overseas on Tuesday, when the Reserve Bank of Australia lifted interest rates by 25 basis points to 4.35%, its first increase in months.
Back in the U.S., markets priced in a 90.2% probability that the Fed will leave interest rates unchanged at 5.25%-5.50% on Dec. 13, according to the CME FedWatch tool. The chance of a 25-basis-point rate hike to a range of 5.50%-5.75% by the end of January was seen at 14.8%.
In U.S. economic data released on Tuesday, the trade deficit climbed almost 5% in September to $61.5 billion, but remained near a three-year low. Meanwhile, the latest report on household debt from the New York Fed showed that credit-card debt hit a record high in the third quarter.
Also on Tuesday, Minneapolis Fed President Neel Kashkari, in an interview on Bloomberg, said that officials have not discussed what it would take to cut interest rates. His colleague, Chicago Fed President Austan Goolsbee, said October’s slowdown in job creation was welcome news because it brought the labor market into “a more balanced” and sustainable growth.
The Treasury’s $48 billion auction of 3-year notes came in as-expected on Tuesday.
What analysts are saying
The first half of next year is “when the divergence between ‘good’ U.S. data and ‘bad’ rest-of-the-world data reverses upon a U.S. consumer-led slump,” according to Thierry Wizman, Macquarie’s global FX and interest rates strategist, and others at the firm.
“But the real ‘juice’ is in UST bonds. They should be bought, as 10-year yields may decline toward 4% as the slump becomes more evident,” the Macquarie team wrote in a note on Tuesday.
Gold remains stable while volatility rocks Bitcoin and Ethereum’s 2023
Gold, historically viewed as a store of value and a hedge against economic turbulence, is often the benchmark asset against which many others are gauged. In the crypto age, Bitcoin (BTC) and Ethereum (ETH) have emerged as contenders to gold’s throne, not as direct replacements but as modern alternatives representing a new breed of digital assets.
Evaluating their performance against gold provides insights into market sentiment, the evolving landscape of investment, and the potential risks and rewards associated with both traditional and digital assets. In 2023, the trajectories of Bitcoin, Ethereum, and gold were notably distinct.
Bitcoin showed its volatile nature throughout the year. On average, BTC grew by 6.90% monthly. In April, it reached a remarkable peak performance of 46.99%, but the winds shifted in June, pushing it to a dip of 14.99%. Ethereum followed a similar pattern, albeit with slightly subdued fluctuations. Ethereum’s monthly average ascent was 3.70%. Its peak was in May, touching 40.82%, but by July, it faced a decline of 17.34%.
Contrasting sharply with the two leading cryptocurrencies, gold moved with more predictability. Across 2023, its average monthly price adjustment was a modest 0.87%. March witnessed its highest surge, hitting 11.04%, while September observed a dip of 7.09%.
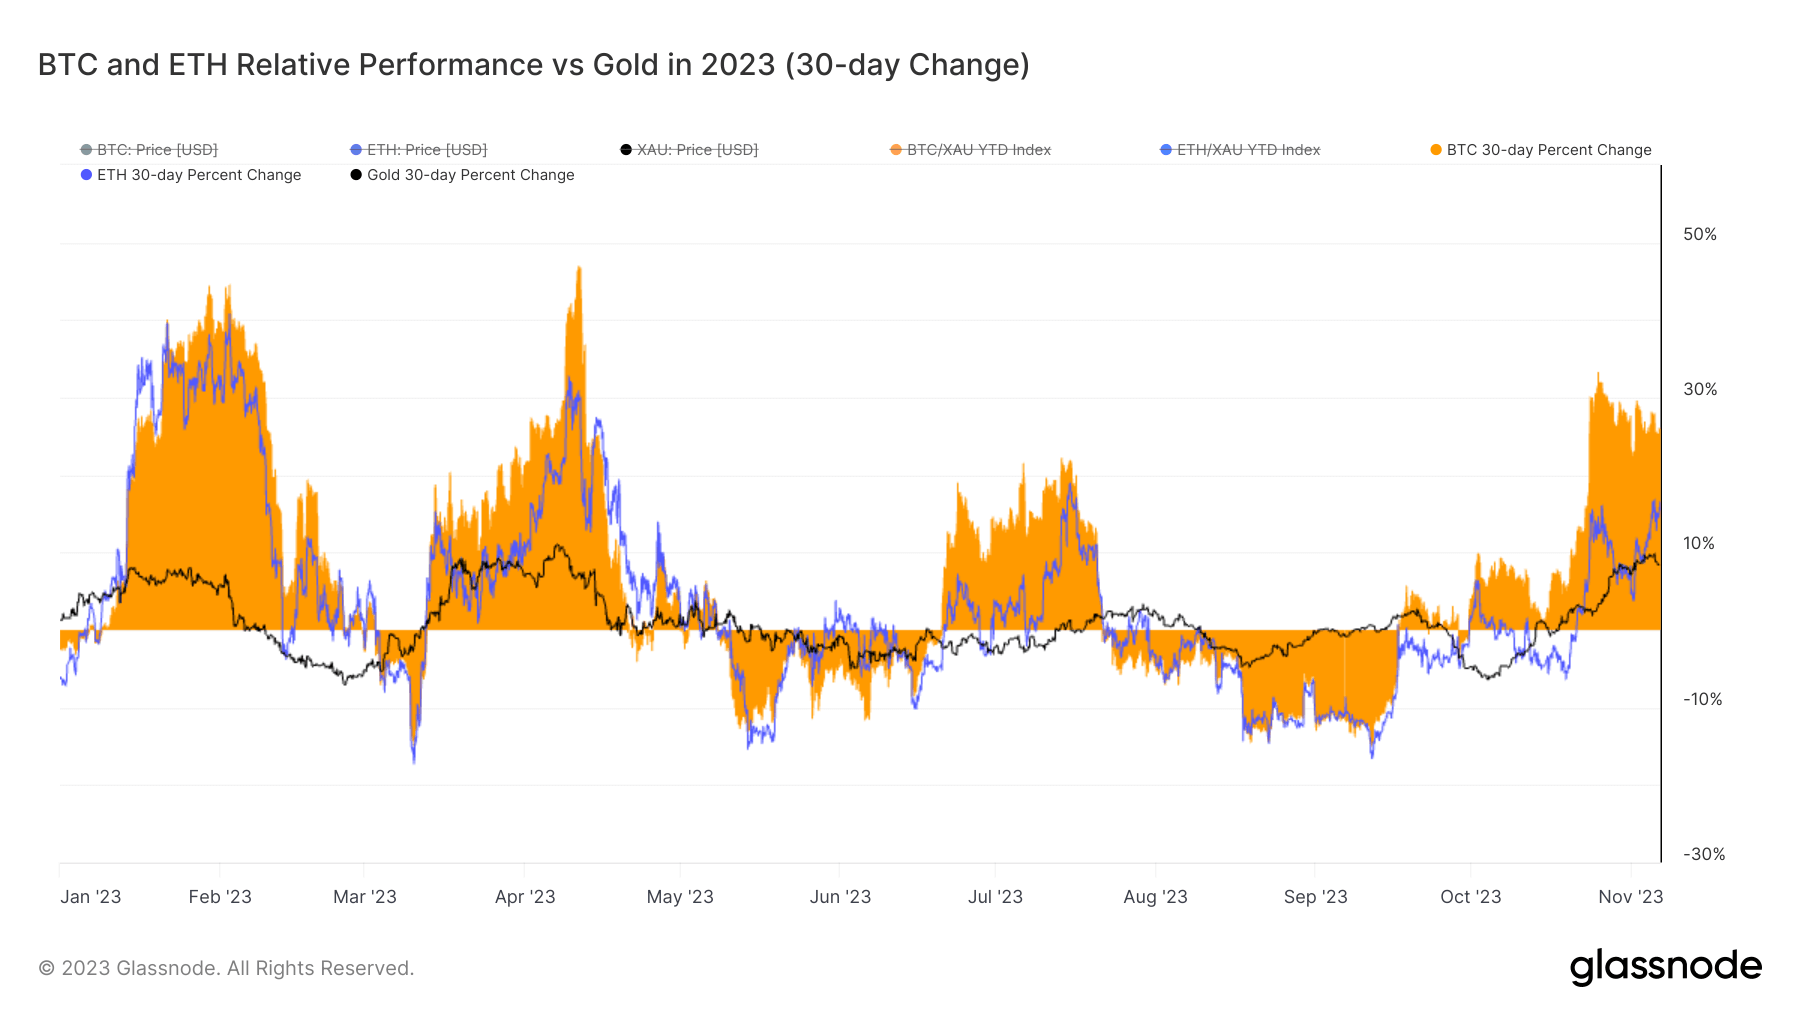
Reflecting on the entire year, Bitcoin’s assertive presence in the crypto market was undeniable. By November, it surged 111.76%. Ethereum, while not mirroring Bitcoin’s meteoric rise, still recorded a year-to-date growth of 58.72%. Gold, ever the steady performer, increased by 8.84% since the beginning of the year.
These dynamics underscore several pivotal market narratives. Firstly, the pronounced volatility in cryptocurrencies underscores both their potential for significant returns and their susceptibility to sharp declines. This dual-edged nature of digital assets is a testament to their nascent stage in the financial ecosystem, influenced by factors ranging from regulatory developments to technological advancements.
Gold’s modest yet steady performance reinforces its reputation as a stabilizing asset, one less susceptible to the rapid market movements often associated with cryptocurrencies. It remains a favored choice for investors seeking a hedge against broader market uncertainties, even as its returns are overshadowed by the more aggressive growth trajectories of digital assets.
The post Gold remains stable while volatility rocks Bitcoin and Ethereum’s 2023 appeared first on CryptoSlate.
Since its inception, Bitcoin has (almost) always been the poster child for volatility. Yet, the Bitcoin price is hardly moving in any direction at the moment. But the latest data suggests a surprising twist in the tale.
As per a recent report by on-chain data provider Glassnode, “Bitcoin markets are experiencing an incredibly quiet patch, with several measures of volatility collapsing towards all-time lows.” This raises the question: Are we entering a new era of Bitcoin price stability, or is the market misreading the signs?
Historical Context For The Volatility Of Bitcoin
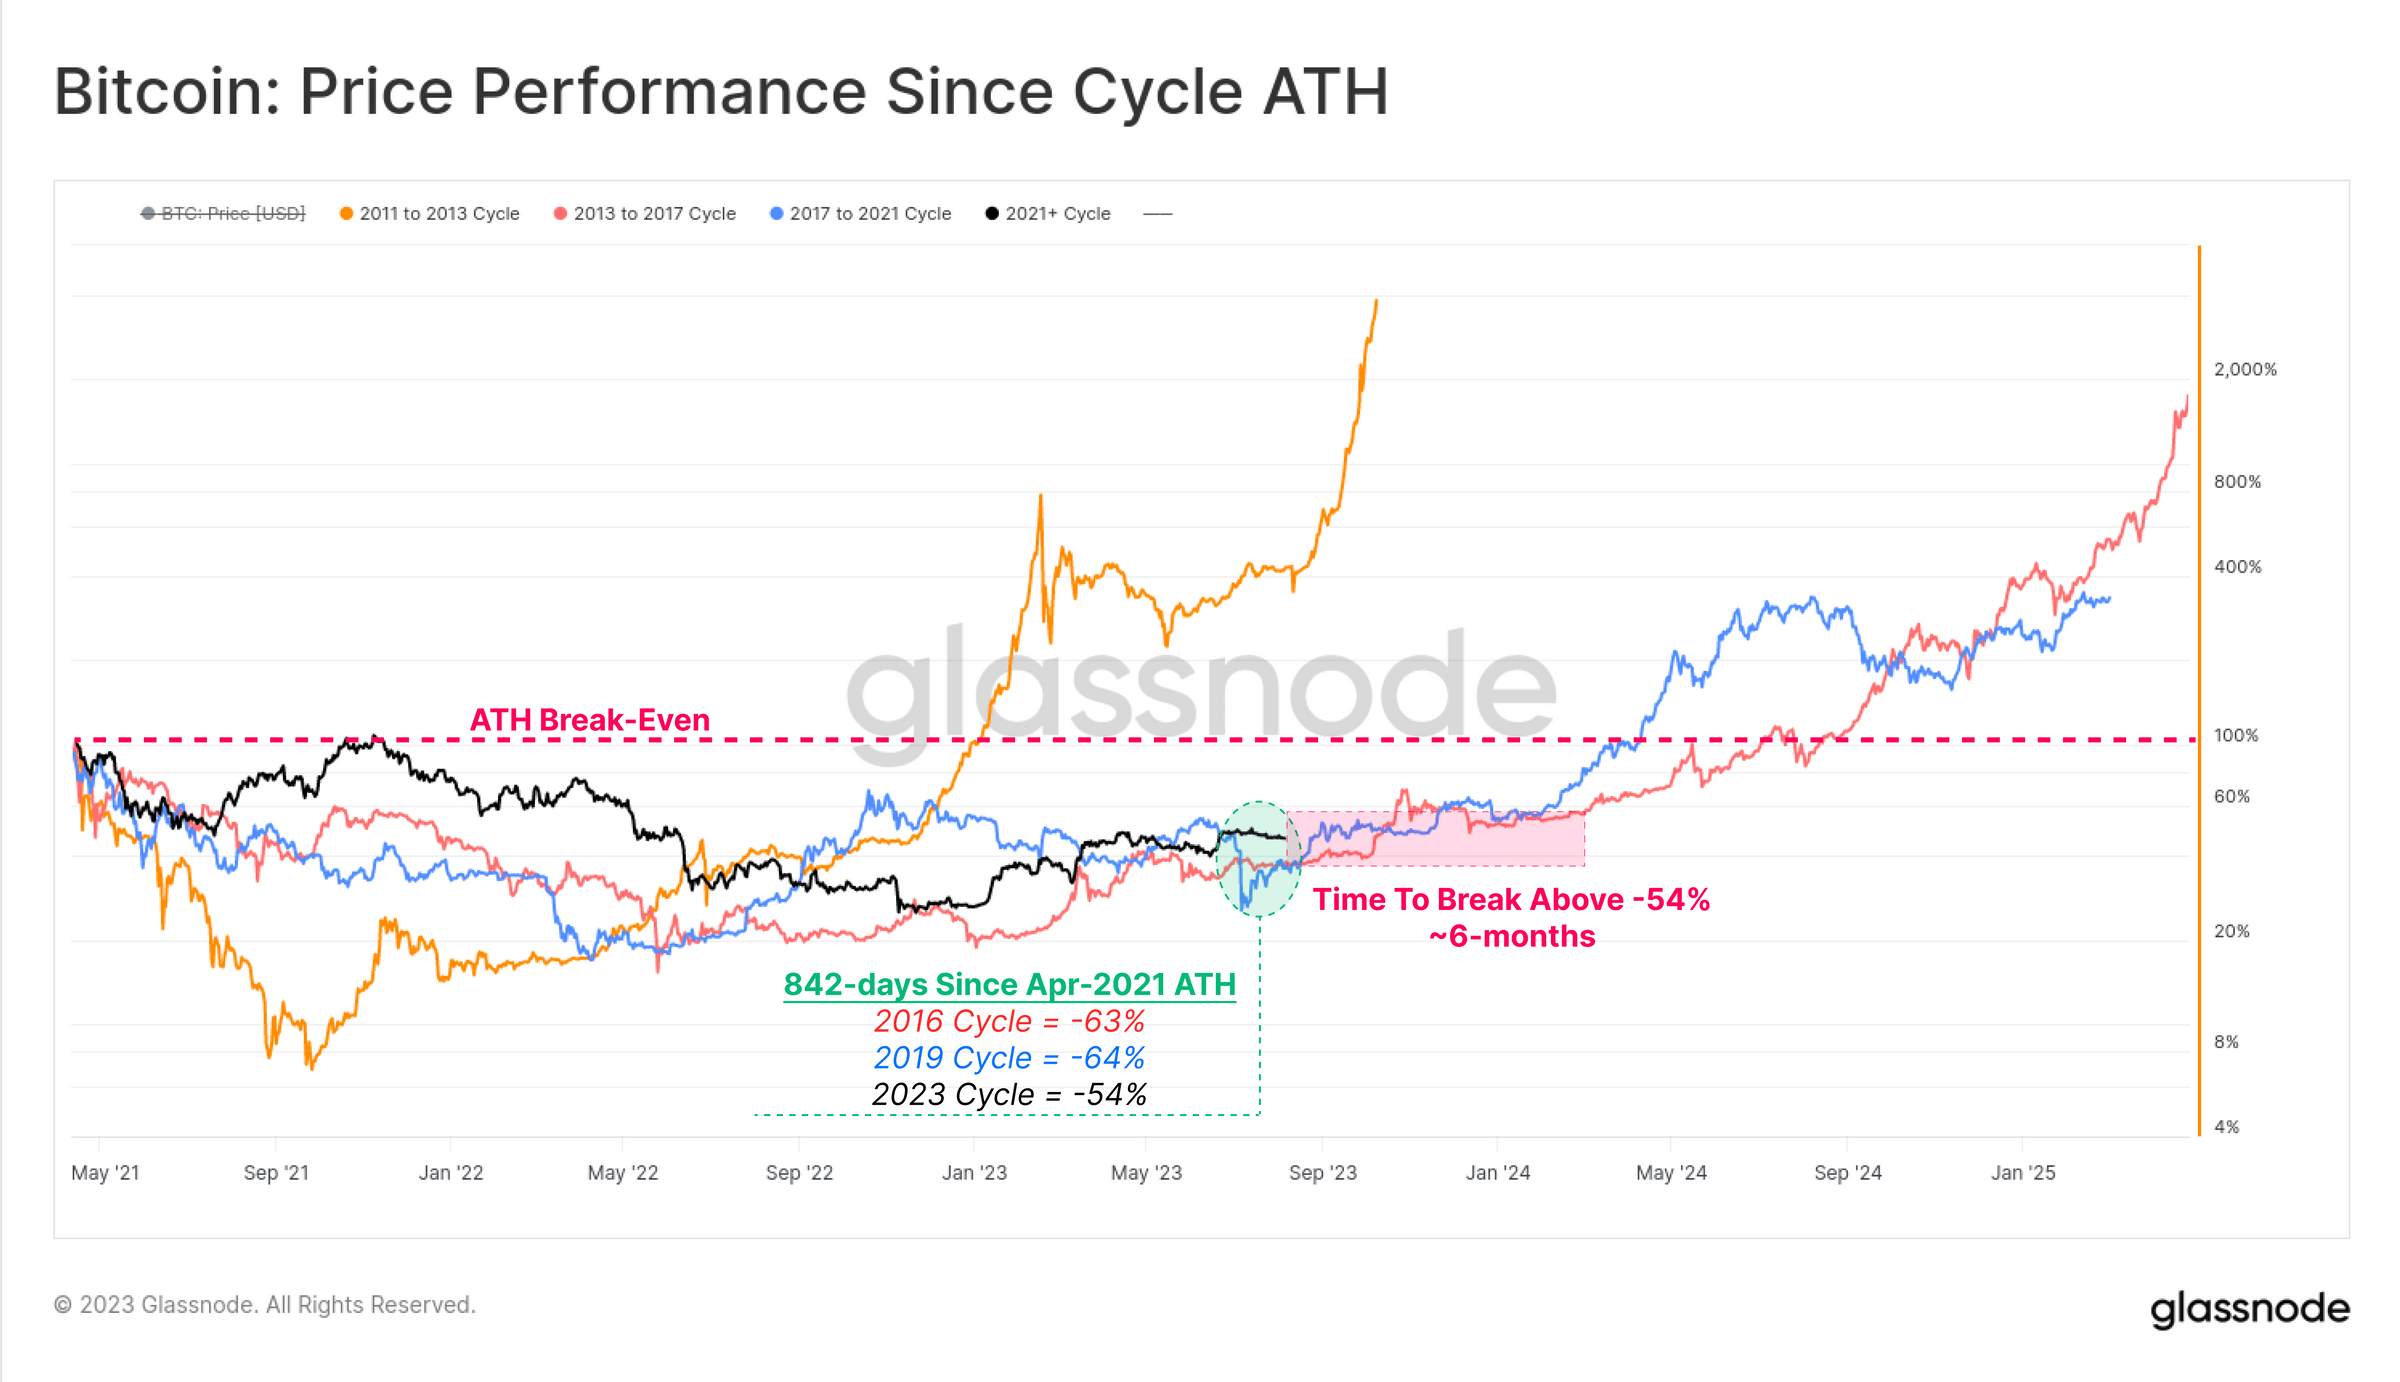
To truly understand the current state of the market, it’s essential to delve into the historical context. The Glassnode report notes, “It has been 842-days since the bull market peak was set in April 2021.” During this period, Bitcoin’s recovery has been more robust than in previous cycles, trading at -54% below its all-time high (ATH), compared to a historical average of -64%.
Drawing parallels with past cycles, the report highlights that both the 2015-16 and 2019-20 cycles underwent a “6-month period of sideways boredom before the market accelerated above the -54% drawdown level.” This could be indicative of a similar “boredom” phase in the current cycle.
One of the most striking revelations from the Glassnode report is the extreme volatility compression Bitcoin is currently undergoing. “Bitcoin realized volatility ranging from 1-month to 1-year observation windows has fallen dramatically in 2023, reaching multi-year lows.” This is reminiscent of four distinct periods in Bitcoin’s history, including the late stage of the 2015 bear market and the post-March 2020 consolidation following the outbreak of COVID-19.
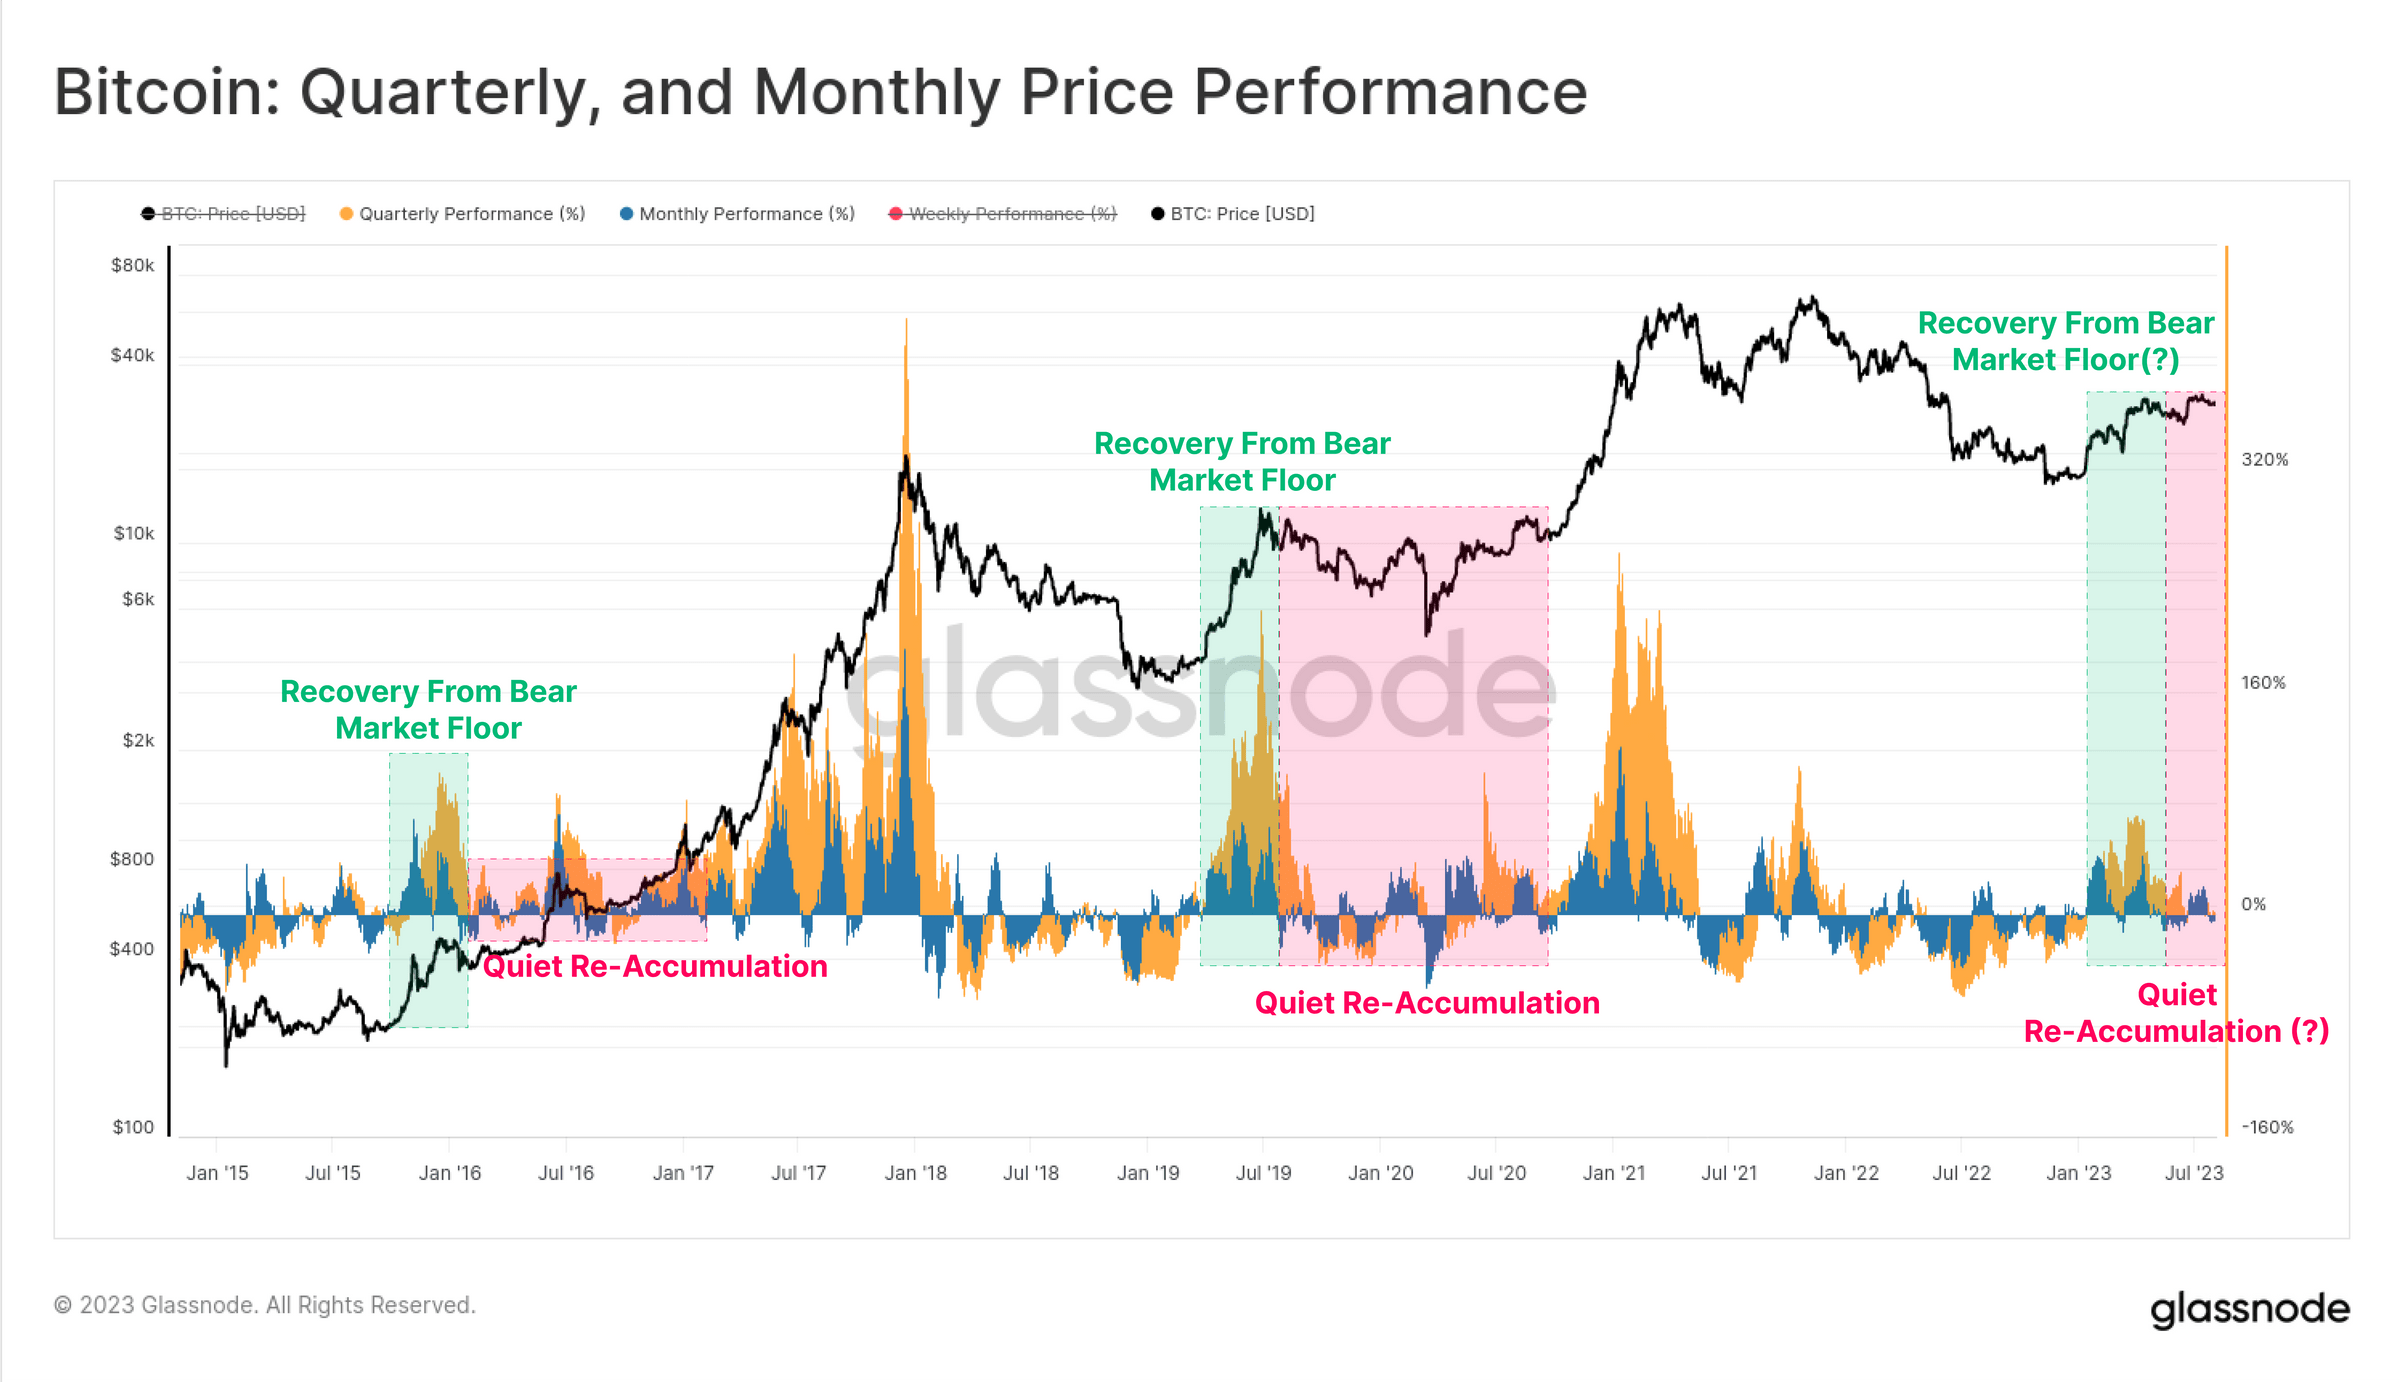
Following the furious rally at the beginning to 2023, the price performance on both a quarterly and monthly basis has moderated. This mirrors Bitcoin’s previous cycles where the initial surge from the low is robust, but then transitions into a prolonged phase of uneven consolidation, a phase of re-accumulation.
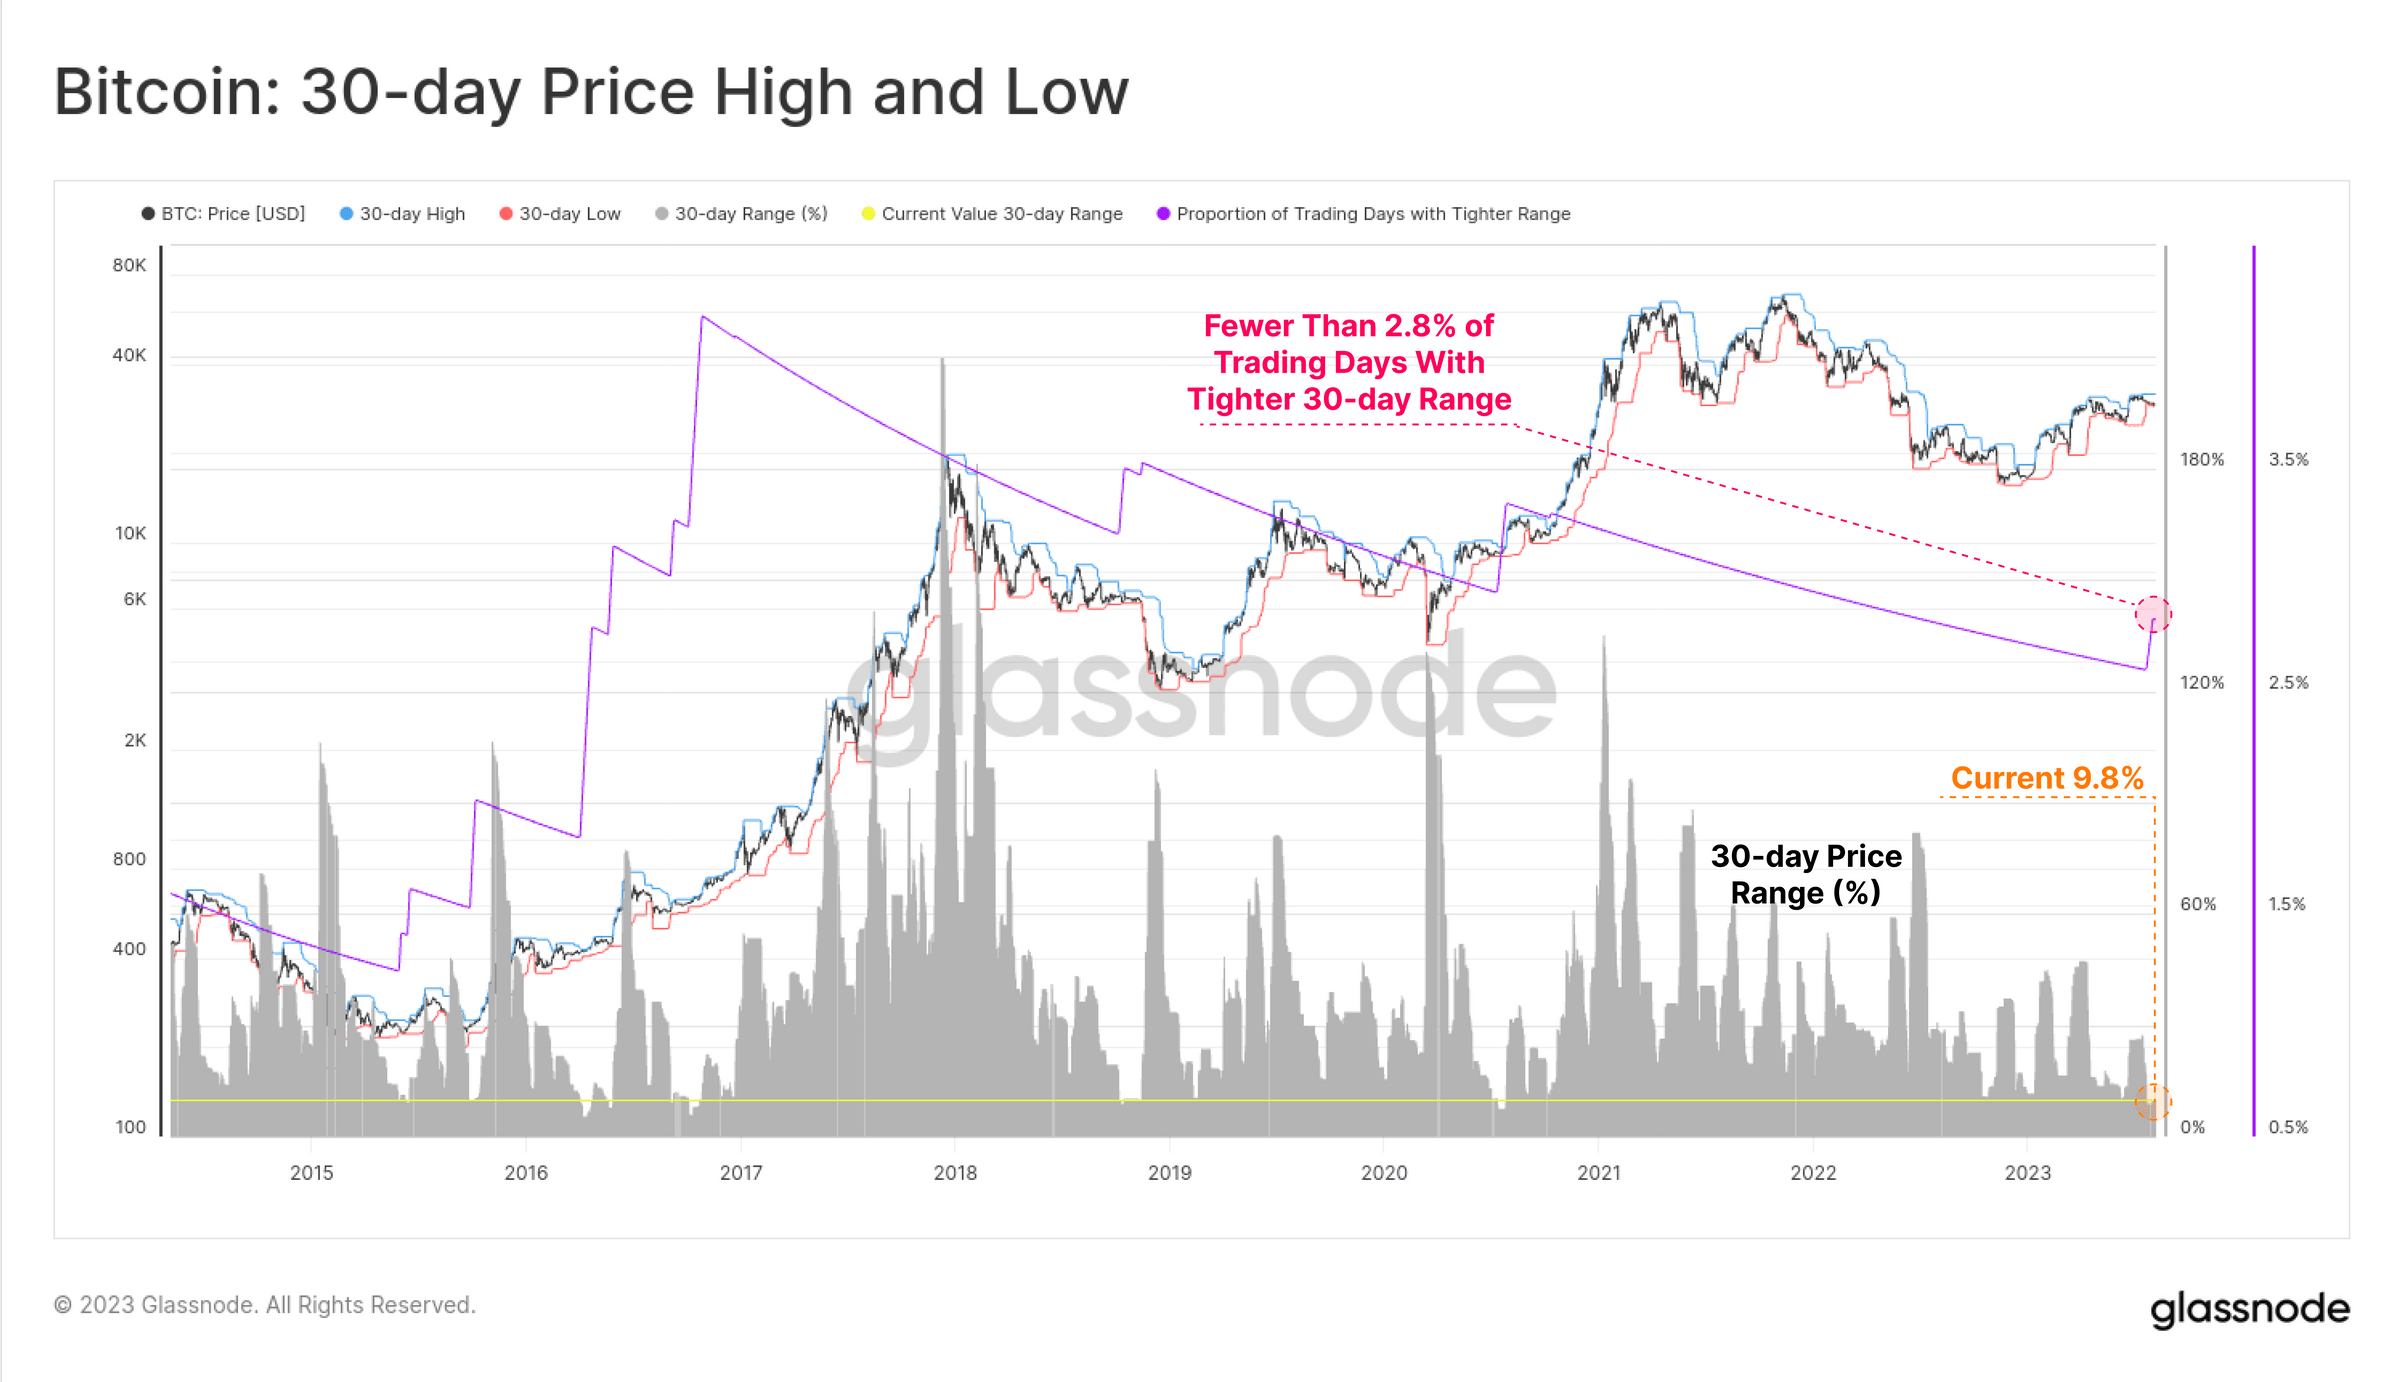
Furthermore, the report states, “The price range which separates the 7-day high and low is just 3.6%. Just 4.8% of all trading days have ever experienced a tighter weekly trade range.” The 30-day price range is even more extreme, constricting price to just a 9.8%, and with only 2.8% of all months in BTC’s history being tighter. Such levels of price compression are rare for Bitcoin, suggesting an anomaly or a potential precursor to a significant market move.
Derivatives Market Insights
The derivatives market, often seen as a barometer for underlying asset sentiment, is also echoing this quiet spell. “The combined Futures and Options trade volume for [BTC and ETH] are at, or approaching all-time-lows,” the report notes. This is further emphasized by the fact that “BTC is currently seeing $19.0B in aggregate derivatives trade volume, whilst ETH markets have just $9.2B/day.”
Interestingly, the options market is showing signs of a significant “volatility crush.” As per Glassnode, “Options are pricing in the smallest volatility premium in history, with IV between 24% and 52%, less than half of the long-term baseline.” This is further corroborated by the historically low Put/Call Ratio and the 25-delta skew metric, suggesting a net bullish sentiment in the market.
The crux of the matter lies in interpreting these signs. The report aptly questions, “Given the context of Bitcoin’s infamous volatility, is a new era of BTC price stability upon us, or is volatility mispriced?” Historically, periods of low volatility in Bitcoin have often been followed by significant price movements. Whether this is a calm before a storm or a genuine shift towards a more stable Bitcoin remains to be seen.
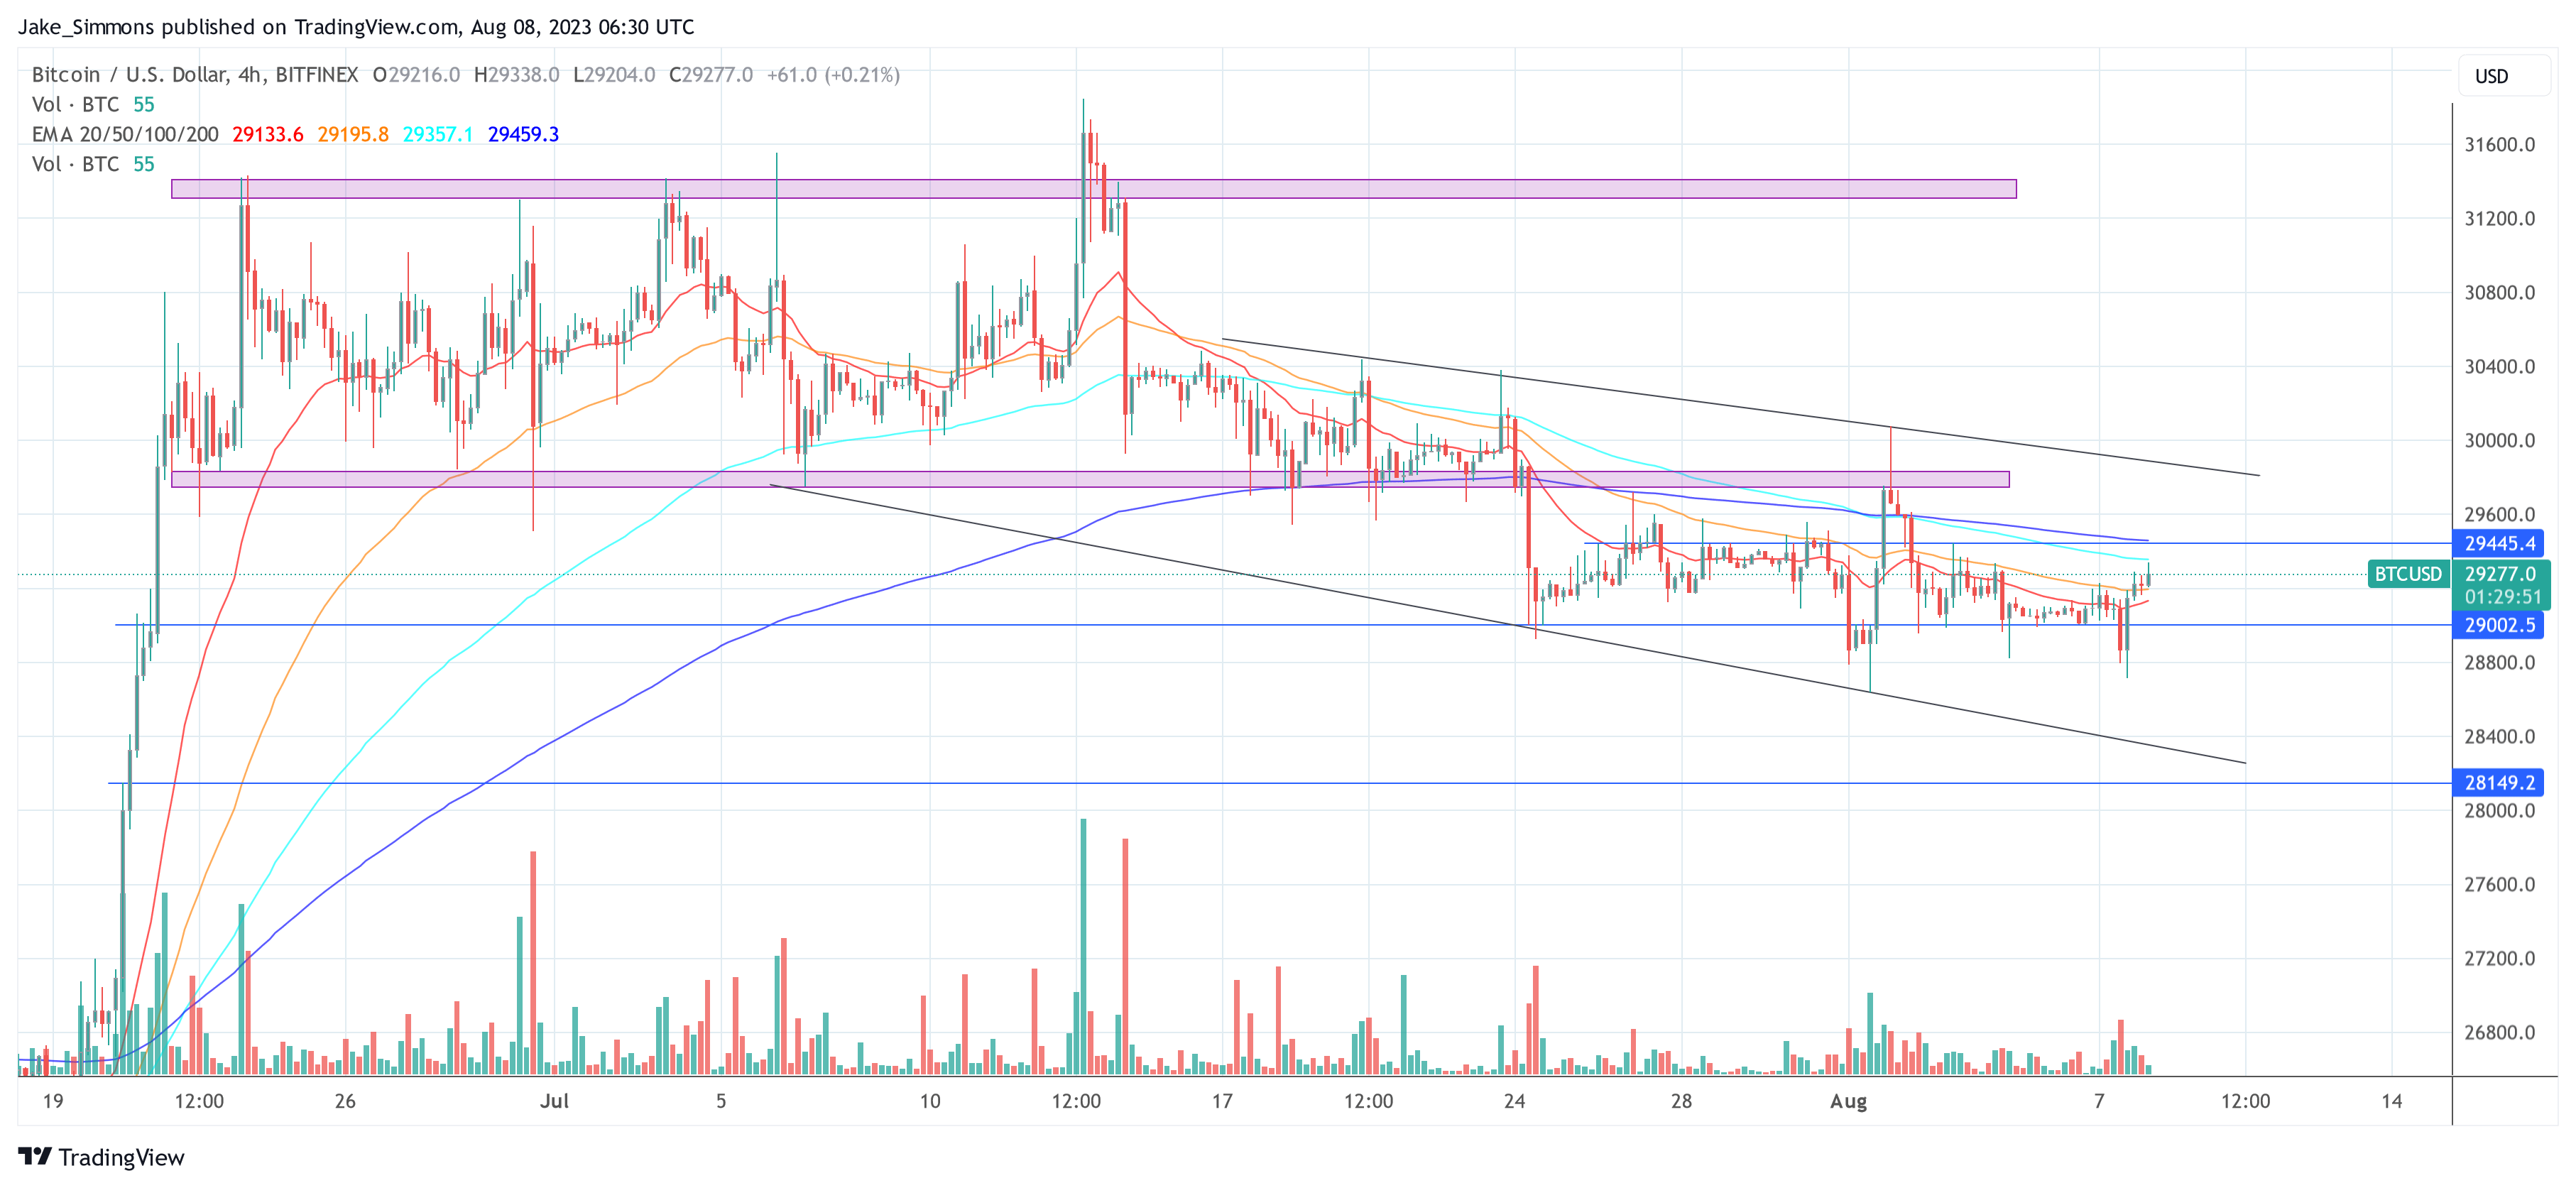
But as Tony “The Bull”, the chief chart technician at NewsBTC, has pointed out yesterday, the technical indicators are also pointing to a prolonged period of re-accumulation, meaning that the phase of low volatility is likely to continue for some time to come.
At press time, the BTC price was at $29,277.
Featured image from iStock, chart from TradingView.com


