
The former FTX CEO is headed back to prison and awaits a potential second trial in March, while his lawyers pledged to “continue to vigorously fight the charges against him.“

The former FTX CEO is headed back to prison and awaits a potential second trial in March, while his lawyers pledged to “continue to vigorously fight the charges against him.“

Artificial Intelligence crypto coins have recently experienced a significant surge in the market, drawing the attention of investors and enthusiasts alike. The sudden upward trajectory of these digital assets has raised questions about the underlying factors driving this extraordinary momentum.
While the domain of artificial intelligence (AI) has rapidly expanded in recent times, its intersection with the world of cryptocurrencies has become a focal point of interest and speculation.
The surge in AI crypto coins, including Injective (INJ), The Graph (GRT), Render (RNDR), and Fetch.ai (FET), has been remarkable over the past 24 hours and the last seven days.
Notably, Fetch.ai (FET) has surged by an impressive 55.16%, followed closely by Injective (INJ) at 43.86%, Render (RNDR) at 28.19%, and The Graph (GRT) at 21.93%.
These substantial gains indicate a growing trend in the market, reflecting an increasing demand for AI-focused digital assets. Investors are drawn to the potential of these tokens, recognizing the unique opportunities they present within the ever-evolving landscape of AI technology and blockchain integration.
The recent surge in AI crypto coins can be attributed to various factors, including the rapidly expanding influence of AI technology across diverse sectors. The marriage of AI and cryptocurrencies presents a promising synergy, with AI’s capabilities enhancing the efficiency and security of various blockchain-based systems. Unlike traditional cryptocurrencies, AI crypto coins leverage advanced algorithms and data-driven insights to optimize performance and facilitate more robust decision-making processes.
Furthermore, the growing investment interest in AI startups by tech giants such as Google and Amazon has significantly fueled the momentum behind AI-focused digital assets. Google’s recent $2 billion investment in Anthropic, an AI startup, and Amazon’s substantial $4 billion investment in the same company in September have sent a clear signal to the market. These investments not only demonstrate the confidence of tech industry leaders in the potential of AI but also underscore the significance of AI’s integration with various technological domains, including the cryptocurrency space.
Total crypto market cap at $1.251 trillion on the daily chart: TradingView.com
The current surge in AI crypto coins highlights a broader shift in the market sentiment, emphasizing the increasing importance of AI’s role in shaping the future of digital finance. As AI technologies continue to evolve and permeate various industries, the demand for AI-driven solutions within the cryptocurrency realm is expected to grow exponentially.
This trend signifies a fundamental transformation in the way investors perceive the value and potential of digital assets, as they increasingly recognize the power of AI in driving innovation, efficiency, and security within the crypto space.
(This site’s content should not be construed as investment advice. Investing involves risk. When you invest, your capital is subject to risk).
Featured image from Freepik

The monthly trading volume of LooksRare, a decentralized non-fungible token (NFT) and digital collectible marketplace, is down 97%, crashing from $71.9 million registered in September 2023 to just $2.1 million in October, Token Terminal data shared by Web3 Academy on October 26, via X shows.
The unprecedented drop in activity couldn’t be pinned on any particular LooksRare-related event when writing on October 26. This contraction is despite the broader cryptocurrency market recovering, rising as seen by the welcomed expansion of leading assets, including Bitcoin (BTC) and Ethereum (ETH).
According to trackers, monthly volume has been falling steadily since April 2023. Then, the average volume exceeded $150 million, pointing to rising interest, especially from traders. At that time, it should be noted that most crypto assets were also growing.

Specifically, Bitcoin broke higher, touching $30,000, triggering demand and reviving hopes that the market was looking up again following the collapse in 2022. By June through September, the average monthly volume in LooksRare had more than halved before plunging to less than $3 million in October 2023.
The spike in monthly trading activity in April coincided with the release of LooksRare v2, which saw the platform’s developers reduce trading fees by 75% from 2% to 0.5%. The updated version is also more gas efficient, allowing traders to save up to 30% on gas compared to the previous edition. Moreover, with LooksRare allowing traders to place bulk orders when buying or selling, monthly volume rapidly rose in April.
With activity rapidly contracting, LOOKS, the native token of LooksRare, has also been flat-lining, looking at price action. The token trades around the $0.070 level at spot rates, retesting August highs. However, an inverted hammer suggests that the uptrend momentum could wane, and bears might reverse gains.
Despite concerns, LOOKS is up 60% from H2 2023 lows and may still rally in the months ahead. Looking at the candlestick arrangement in the daily chart, a close above $0.070 with expanding volumes could set the ball rolling for buyers who expect the token to retest 2022 lows at around $0.12.

Overall, NFT and digital collectible trading activity remains relatively lower, even with bullish traders expecting prices to turn around and rally in 2024. Recently, there was a brief increase in the floor prices of leading NFT collections like Bored Ape Yacht Club (BAYC), Azuki, and CryptoPunk. However, with trading volume and the number of new owners still at record lows, researchers put off the chance of an NFT bull run starting in Q4 2023.
Feature image from Canva, chart from TradingView

Google Maps Immersive view
Google Maps is expanding preexisting features and unveiling some new ones, according to a Thursday announcement.
The company said artificial intelligence allowed for improvements to Google Maps’ EV charging station feature, more specific recommendations of nearby activities and more in-depth visualization. Many of the new features use neural radiance fields, an AI subset that allows for using 2D images to construct a 3D scene.
“AI has really supercharged the way we map,” Chris Phillips, VP and general manager of Google’s Geo, or geography, division, said on a call with reporters.
New ways to search for things to do
Google Maps is offering new ways for people to search for activities to do near them as well. The company noticed how often users were typing generic phrases such as “things to do” in a given area, and now they will get an information return with more specialized information.
Instead of getting a random list of activities near you, Google Maps will return a categorized list of activities grouped by topic. So, Google said, if you search for things to do in Tokyo, you will get responses such as “anime,” “cherry blossoms” and “art exhibitions,” and you can get more granular from there.
The updated EV charging feature in Google Maps.
More on EV
The company is bolstering its EV charging station feature this week, allowing drivers to see when a charging station was used most recently in order to decrease the chances of them driving to a station that does not work.
The function also allows for drivers to see how fast the charger is and if their car is compatible, though those are not new tools.
“As we think about the future of navigation, we know that a big part of that future is electric,” Miriam Daniel, VP and general manager at Google Maps, on the call.
More in-depth visualization features
Google Maps is also expanding its Lens in Maps feature to 50 more cities this week. That function was previously known as “Search with Live View” and allows people to use their phone camera to scan nearby buildings. The camera parses through billions of photos and tells you the store name, reviews and other applicable information of objects it sees.
Google Maps will also have better visualization for its navigating features. Its Immersive View, which Google Maps announced in May, is expanding to more cities, including Los Angeles, New York and San Francisco. It allows users to virtually travel through a planned route.
In the coming months, according to Google, 12 countries will have access to better visuals of buildings and lanes for drivers to see while on their route. In the U.S., there will soon be a way for users to check whether their journey has highways with carpool lanes.

Bankman-Fried’s legal team, led by Mark Cohen and Christian Everdell, has encountered difficulties in presenting a coherent narrative to the jurors.
FTX co-founder Sam Bankman-Fried‘s trial is nearing its conclusion, with the prosecution set to conclude their case on October 26 after nearly 20 testimonies. The prosecution has called upon a wide range of witnesses over the past three weeks, including former FTX employees, customers, investors, government officials, and law enforcement agents.
The central argument of the case revolves around the allegation that Bankman-Fried intentionally deceived these parties and played a role in the events leading to the $8 billion discrepancy between FTX and Alameda Research in November 2022.
On the other hand, Bankman-Fried’s defense team has not yet confirmed whether they will present a case. If they do choose to present a defense, it will commence on October 26.
Bankman-Fried’s legal team, led by Mark Cohen and Christian Everdell, has encountered difficulties in presenting a coherent narrative to the jurors. Their challenges included missing crucial arguments during cross-examinations of Bankman-Fried’s former close associates, which included Caroline Ellison, Nishad Singh, Adam Yedidia, and Gary Wang. These individuals, cooperating with the government, accused Bankman-Fried of instructing them to engage in unlawful activities.
An attorney who observed the trial noted that when the government initiates a case, there’s a 95% likelihood of securing an indictment, highlighting the substantial hurdle facing the defense. Nevertheless, the prosecutors bear the responsibility of providing evidence to substantiate the alleged crimes.
Furthermore, over the past few days, FTX’s former general counsel, Can Sun, provided a spreadsheet that was utilized to monitor $2.1 billion in loans extended to Bankman-Fried and other executives. During his testimony, Can Sun revealed that he had no knowledge of the exchange’s mingling of funds with Alameda. It’s worth noting that he is cooperating with the government in the ongoing case.
The market for FTX creditor claims is gaining momentum, with reports of some claims selling for over 50 cents on the dollar. Thomas Braziel, a partner at 117 Partners, a firm specializing in crypto bankruptcy claims, revealed that a claim exceeding $20 million recently went for a price range of 52 to 53 cents in an auction on October 20.
Braziel emphasized that only the highest-quality claims tend to reach such prices. Smaller claims ranging from $500,000 to $800,000 and above are trading in the range of high 30 cents to low 40 cents. This trend seems to be influenced by recent clawback efforts by the bankrupt crypto exchange and capital-raising endeavors of a previously invested company.
While the interest in FTX claims is on the rise, Braziel noted that there are still some lingering concerns. However, the upward trend in claim valuations remains a positive sign for creditors. Braziel commented, “There’s still a lot to iron out. KYC and AML issues are still popping up.”
next

Bhushan is a FinTech enthusiast and holds a good flair in understanding financial markets. His interest in economics and finance draw his attention towards the new emerging Blockchain Technology and Cryptocurrency markets. He is continuously in a learning process and keeps himself motivated by sharing his acquired knowledge. In free time he reads thriller fictions novels and sometimes explore his culinary skills.
In this video, Fool.com contributor Parkev Tatevosian discusses the latest developments out of Tesla (TSLA -3.69%).
*Stock prices used were the afternoon prices of Oct. 19, 2023. The video was published on Oct. 21, 2023.
Parkev Tatevosian, CFA has no position in any of the stocks mentioned. The Motley Fool has positions in and recommends Tesla. The Motley Fool has a disclosure policy.
Parkev Tatevosian is an affiliate of The Motley Fool and may be compensated for promoting its services. If you choose to subscribe through his link, he will earn some extra money that supports his channel. His opinions remain his own and are unaffected by The Motley Fool.

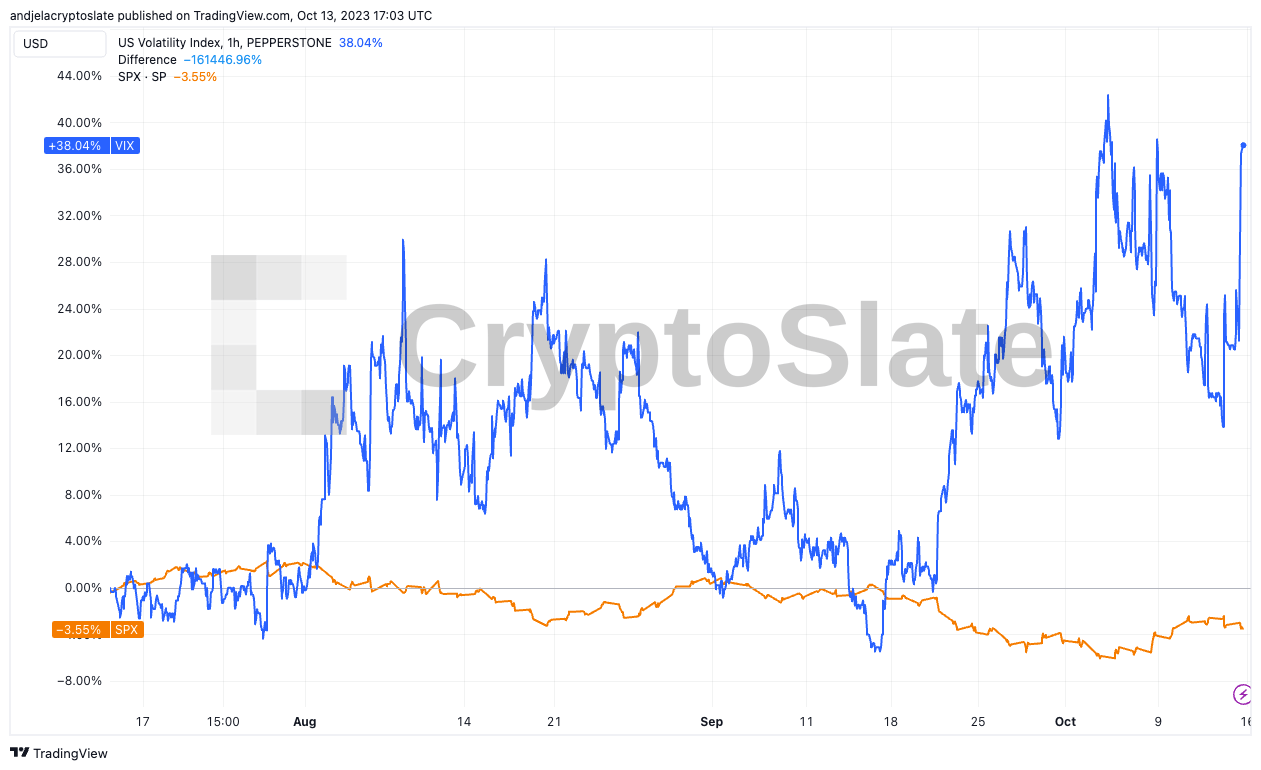
The financial world relies heavily on indicators to gauge market sentiment and predict future trends. Among these, the Volatility Index, commonly known as the VIX, stands out as a prominent measure of market anxiety.
Originating from the Chicago Board Options Exchange, the VIX is an index that represents the market’s expectation of 30-day forward-looking volatility. Calculated from the implied volatilities of a wide range of S&P 500 index options, a high VIX typically signals heightened investor fears, while a low reading suggests a calm market.
On the other hand, the S&P 500 Index, or SPX, serves as a beacon for the overall health of the U.S. stock market. Comprising 500 of the largest U.S. companies by market capitalization, its movements are watched closely by traders, analysts, and institutional investors alike. Historically, the VIX and the SPX have shared an inverse relationship: as the SPX rises, indicating bullish sentiment, the VIX usually decreases, suggesting reduced market anxiety, and vice versa.
Yet, recent market data paints an unusual picture. Over 3 months, the SPX witnessed a decline of 3.37%, a clear indication of some bearish sentiment. However, the VIX skyrocketed during the same period, increasing 38.41%.
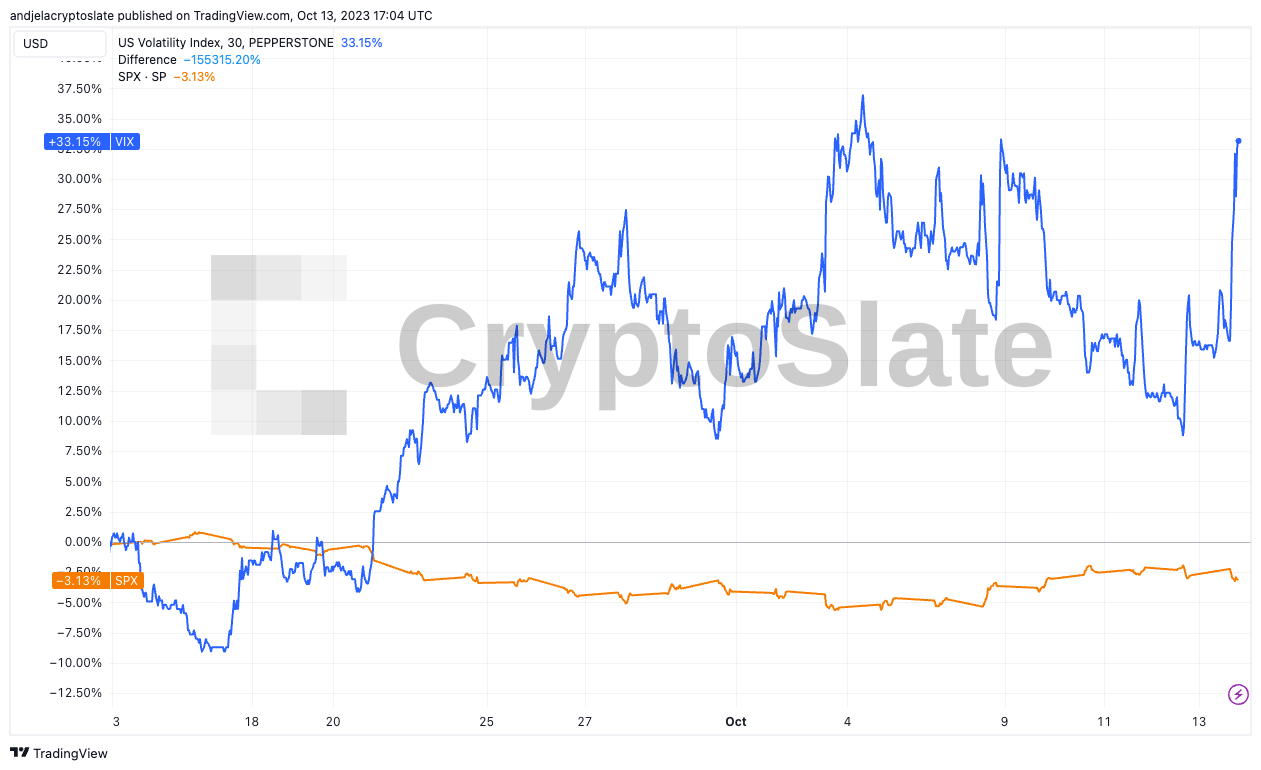
This divergence is also observed in a narrower 1-month window: the SPX declined by 3%, while the VIX surged by 32.8%.
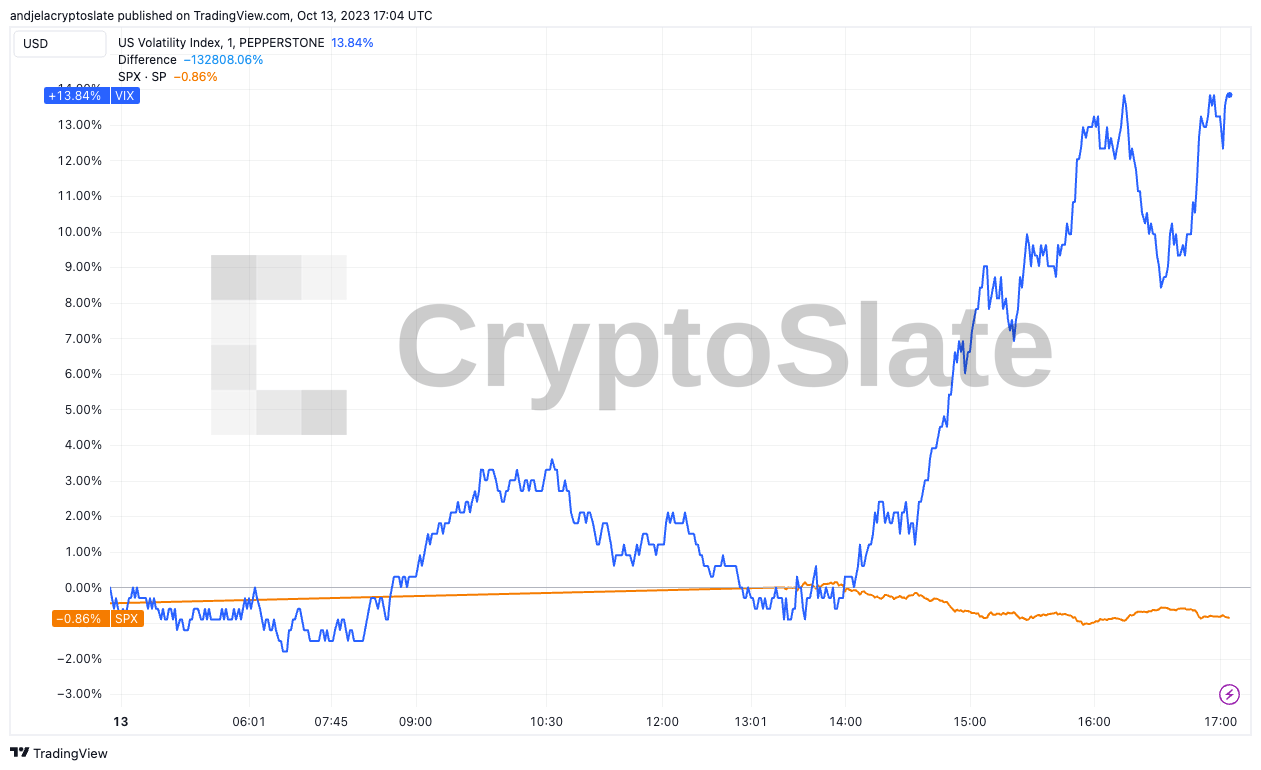
The discrepancy on Oct. 13 was even more pronounced — in just a single trading day, the VIX jumped by an alarming 13.54%. Meanwhile, the SPX, rather than reflecting this spike in volatility, remained almost unchanged, registering a mere 0.82% dip.
This stark divergence prompts questions. Several factors could be contributing to this anomaly. Firstly, the market might be anticipating significant future movements in the SPX that aren’t yet reflected in its current value. Secondly, external events or geopolitical tensions could impact market derivatives more than the cash market, leading to an exaggerated VIX. Lastly, structural changes or shifts in market dynamics and participants could alter the traditional relationship between the two indices.
For investors and market participants, such discrepancies are cause for vigilance. While the VIX’s primary role is to measure market sentiment, its current dislocation from the SPX may indicate underlying market stresses or potential forthcoming volatility. Traders might interpret this as a sign to hedge their positions or prepare for potential market swings.
The post VIX surges while SPX remains steady: What’s behind the anomaly? appeared first on CryptoSlate.

Edward Farina, the founder and CEO of various crypto-focused initiatives, is confident that XRP is a better “investment” in early October than it was before July when the United States Securities and Exchange Commission (SEC) claimed that the coin was an unregistered security.
In a post on October 9, Farina asserted that the coin was declared not a “security,” but was bothered by the fact that prices are at “the same level” as before the July 13 ruling.
XRP, the native coin of the XRP Ledger, a decentralized blockchain that recently supported smart contracts, remains one of the most liquid crypto assets. Looking at price data from CoinMarketCap (CMC), the coin is lodged at fifth in the market cap leaderboard, trailing Bitcoin (BTC), Ethereum (ETH), BNB, and USDT–the stablecoin.
At this level, the coin is one of the most liquid and has managed to shake off bear pressure since the SEC lodged a lawsuit against some of Ripple’s top brass, including Brad Garlinghouse. In the lawsuit filed in late 2020, the agency said Ripple conducted an illegal crowdfund, raising over $1 billion by selling unregistered securities. With the allegations, XRP prices fell by 78%, crashing from around $0.77 to $0.17 in days.

XRP found reprieve in 2021 when it shook off losses, rallying to as high as $1.95 despite the ongoing lawsuit where Ripple lawyers defended the company against claims put forward by the regulator. Prices fell in 2022, reversing gains before stabilizing in the better half 2023.
In July, XRP prices rose sharply, briefly reaching $0.92 before cooling off, peeling back all gains in mid-August. Prices have stabilized, but bears wiped gains from the rally induced on July 13 when a United States court ruled that XRP is not a security when sold to the general public on an exchange. Still, it is when sold to institutional investors.
In early October 2023, Judge Analisa Torres barred the SEC from appealing the decision made in July, stating that there was no “substantial ground for difference of opinion.” The trial is not set for April 2024.
Following the Judge’s decision barring the agency from appealing, XRP prices have been relatively firm but at pre-July 2023 levels. Farina believes that XRP ought to be higher at spot rates, a reason why the market “makes absolute zero sense and price manipulation is real.”
Whether XRP prices are manipulated or not is not clear at spot rates. However, the broader crypto market, including Bitcoin and Ethereum, is suppressed, having cooled off from July 2023 highs.
Feature image from Canva, chart from TradingView

Aramark (ARMK 3.12%) has spun off its uniform and workplace supply unit into a new company. The deal is done, but some stock-tracking services have been slow to adjust, which is causing Aramark shares to appear to be down nearly 30% on Monday morning.
Long-term investors need not worry about the drop.
Aramark has established itself as a key vendor to universities, sports teams, and large companies, providing uniforms, cleaning services, venue management, and food services to a wide range of venues. But the company is in the process of streamlining, and last year, it announced plans to hive off its uniform business into a separate publicly traded company.
That spinoff became official over the weekend, and the new company, Vestis (NYSE: VSTS), began trading on Monday morning. But the split is causing some confusion among stockholders.
Under the terms of the split, Aramark shareholders received one share of Vestis for every two shares of Aramark they held.
On Friday, Aramark closed at $34.69. On Monday morning, it is trading in the neighborhood of $25. But Aramark holders also now own a half share of Vestis for each share of Aramark they owned on Friday. With Vestis trading at about $18, that half share is worth $9. Add that to the share price of the new, slimmed-down Aramark, and shareholders’ stakes continue to be worth about $34 per Friday share.
Indeed, on an adjusted basis, Aramark is down about 1%.
Investors should expect market data providers to adjust in the days to come, and that their comparisons will be corrected as they do. The bigger question for long-term focused investors is whether Aramark and Vestis are worth owning.
Vestis is now North America’s second-largest provider of uniform services, with more than 300,000 customer locations and approximately 20,000 employees. Aramark will continue to focus on facilities management and food services, making sure the big game runs smoothly and the customers have ample food choices while they are there.
Over the past decade, Aramark delivered a total return of 71% prior to the spinoff, underperforming the S&P 500‘s 141% return. The hope is that the two streamlined companies will be better able to invest in growth, and the facilities business in particular is viewed as an attractive opportunity.
There’s potential here, but investors need to understand that despite what their screens might say, Aramark stock is not on sale on Monday. It might be best to let the dust settle and see how these two companies perform before jumping in.
Lou Whiteman has no position in any of the stocks mentioned. The Motley Fool has no position in any of the stocks mentioned. The Motley Fool has a disclosure policy.

Ethereum co-founder Vitalik Buterin also raised concern regarding the concentration of Ethereum’s liquid staking providers.
In his recent blog post, Ethereum co-founder Vitalik Buterin shared his opinion on adding some protocols to the Ethereum blockchain code. He also touched upon the most important part which is the concentration of liquid staking service providers.
Vitalik Buterin discussed several Ethereum protocols, including the account abstraction protocol ERC-4337, ZK-EVMs, private mempools, code precompiles, and liquid staking. He expressed stronger support for “enshrining” some of these protocols, such as ERC-4337, in Ethereum’s code, while he had reservations about others like private mempools. However, he acknowledged that each protocol presents a complex tradeoff that will continue to evolve over time.
Buterin also raised concerns about the concentration of Ethereum’s liquid staking providers. Notably, Lido currently controls over 32% of staked ether, albeit across different validators. Buterin highlighted that both Lido and Rocket Pool, two major providers, carry different risks and have some safety measures in place, though these might not be sufficient.
Rather than relying solely on “moralistic pressure” to promote a more diverse set of staking providers, Buterin contemplated potential protocol changes aimed at further decentralizing liquid staking. These changes could involve adjusting RocketPool’s approach or granting additional governance powers to a randomly selected committee of small stakers.
In the last 24 hours, the Ethereum (ETH) price has gained more than 3.5% shooting all the way to the $1,750 level. The price move comes ahead of the launch of Ethereum futures ETFs and $1,750 serves as a key resistance level for Ethereum.
Ethereum faces major resistance at $1,800, and a successful breakthrough could pave the way for further gains toward $1,850 and $1,920, potentially even reaching $2,000. On the downside, if Ethereum fails to surpass the $1,750 resistance, it may initiate a corrective move.
Initial support lies around the $1,710 level, with a more critical support at $1,680. Additionally, the 76.4% Fibonacci retracement level from the recent rally, positioned near $1,685, offers support. A breach below $1,685 might test the $1,650 support, potentially triggering a bearish trend towards the $1,600 level.
As per the schedule and plans, the Ethereum futures ETF from Bitwise is likely to go live later today, October 2. As of a September 27 note, there are 15 Ether futures ETFs from nine different issuers awaiting approval. These issuers include well-known names like VanEck, ProShares, Grayscale, Volatility Shares, Bitwise, Direxion, and Roundhill.
The analysts assessing the situation have assigned a 90% likelihood of Ether futures ETFs launching in October. Among these offerings, Valkyrie’s Bitcoin futures product, with Bitcoin trading at approximately $28,308, is expected to be the first to include exposure to Ether starting on October 3.
next
Bhushan is a FinTech enthusiast and holds a good flair in understanding financial markets. His interest in economics and finance draw his attention towards the new emerging Blockchain Technology and Cryptocurrency markets. He is continuously in a learning process and keeps himself motivated by sharing his acquired knowledge. In free time he reads thriller fictions novels and sometimes explore his culinary skills.