 The price of bitcoin continued to decline over the weekend, dropping an additional 7.7% in the last 24 hours. It plummeted to a daily low of $61,384 per coin, prompting a significant wave of leveraged liquidations on Saturday. Bitcoin Value Declines Amid Market Instability; Extensive Liquidations Reported By 4:00 p.m. Eastern Time on Saturday, bitcoin’s […]
Source link
turbulence
$9.5 Billion In Bitcoin Options Poised To Expire This Friday: Market Turbulence Ahead?
This Friday, the spotlight is turned to Deribit, the leading crypto derivatives exchange, as it gears up for a notable event in its trading history. Particularly, the exchange is poised to witness the expiration of over $9.5 billion in Bitcoin options open interest.
For context, Open interest refers to the total number of outstanding derivative contracts, such as futures or options, that have not been settled or closed. It represents the number of contracts market participants hold at the end of each trading day.
This surge in open interest recorded by Deribit reflects increased market participation and signals heightened liquidity, marking a notable milestone in the crypto derivatives landscape.
Record-Breaking Open Interest
Notably, this event is significant in two ways: It underscores the growing interest in Bitcoin as an asset class and highlights the increasing “sophistication” of the cryptocurrency market. This is because Open interest can also serve as a critical indicator of market health and trader sentiment.
As such, the record levels of open interest set to expire on Deribit suggest a “vibrant” trading environment, with more investors engaging in complex financial instruments like options.
According to Deribit data, the exchange is set to host one of its largest option expiries ever, with $9.5 billion worth of Bitcoin options poised for expiry at the end of the month. This figure represents a substantial portion, approximately 40%, of the exchange’s total options open interest, which stands at $26.3 billion.
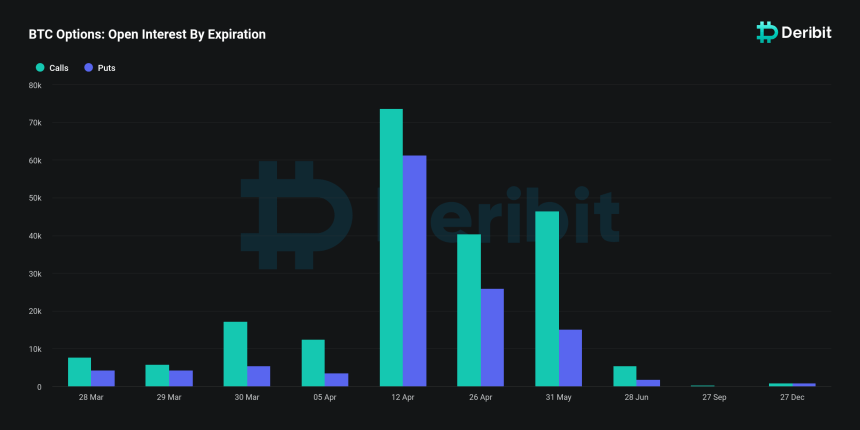
The magnitude of this expiry event eclipses previous months, with January and February end-of-month expiries totaling $3.74 billion and $3.72 billion, respectively. This trend indicates a large increase in market activity and investor engagement on the platform.
Implications Of The Bitcoin Expiry
The upcoming expiry has notable implications for the market, especially considering the current pricing dynamics of Bitcoin.
With Bitcoin’s spot price hovering below $70,000, an estimated $3.9 billion of the open interest is expected to expire “in the money,” according to Deribit analysts, presenting profitable opportunities for holders of these options contracts.
The “max pain” price, which represents the strike price at which the highest number of options would expire worthless, thereby causing the maximum financial loss to option holders, is identified at $50,000.
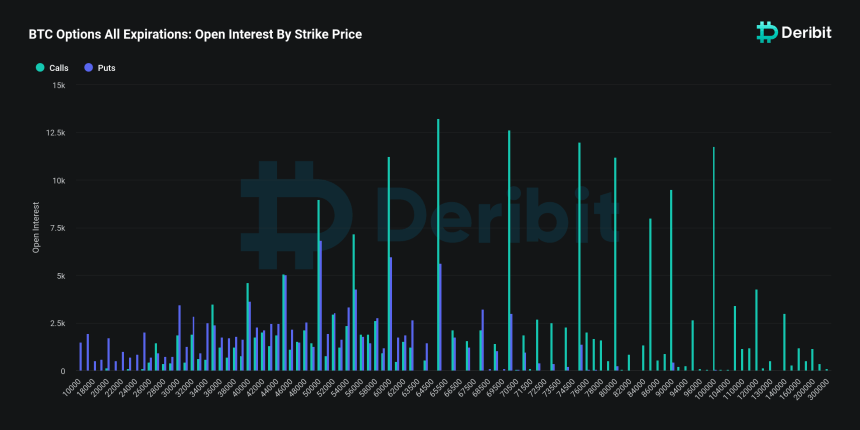
According to the analysts, this scenario suggests that a significant number of traders are positioned to benefit from the current market conditions, potentially leading to “increased buying activity” as these options are exercised.
Additionally, Deribit analysts speculate that the high level of “in-the-money expiries” could exert upward pressure on Bitcoin’s price or amplify market volatility. They added that as traders “hedge their positions” or “speculate on future price movements,” the market may witness a flurry of activity, impacting Bitcoin’s price trajectory in the short term.
This comes at a time when Bitcoin has experienced a slight retracement from its recent all-time high above $73,000, with the price adjusting to approximately $68,946, at the time of writing
Featured image from Unsplash, Chart from TradingView
Disclaimer: The article is provided for educational purposes only. It does not represent the opinions of NewsBTC on whether to buy, sell or hold any investments and naturally investing carries risks. You are advised to conduct your own research before making any investment decisions. Use information provided on this website entirely at your own risk.
Data highlights Bitcoin’s potential path to $40K amid global economic turbulence
Bitcoin (BTC) has been trading within a narrow 4.5% range over the past two weeks, indicating a level of consolidation around the $34,700 mark.
Despite the stagnant prices, the 24.2% gains since Oct. 7 instill confidence, driven by the impending effects of the 2024 halving and the potential approval of a spot Bitcoin exchange-traded fund (ETF) in the United States.
Investors worry about the bearish global economic outlook
Bears expect further macroeconomic data supporting a global economic contraction as the U.S. Federal Reserve holds its interest rate above 5.25% in order to curb inflation. For instance, on Nov. 6, Chinese exports shrank 6.4% from a year earlier in October. Furthermore, Germany reported October industrial production down 1.4% versus the prior month on Nov. 7.
The weaker global economic activity has led to WTI oil prices dipping below $78 for the first time since late July, despite the potential for supply cuts from major oil producers. U.S. Federal Reserve Bank of Minneapolis President Neel Kashkari’s remarks on Nov. 6 set a bearish tone, prompting a “flight-to-quality” response.
Kashkari stated:
“We haven’t completely solved the inflation problem. We still have more work ahead of us to get it done.”
Investors have sought refuge in U.S. Treasurys, resulting in the 10-year note yield dropping to 4.55%, its lowest level in six weeks. Curiously, the S&P 500 stock market index has reached 4,383 points, its highest level in nearly seven weeks, defying expectations during a global economic slowdown.
This phenomenon can be attributed to the fact that the firms within the S&P 500 collectively hold $2.6 trillion in cash and equivalents, offering some protection as interest rates remain high. Despite increasing exposure to major tech companies, the stock market provides both scarcity and dividend yield, aligning with investor preferences during times of uncertainty.
Meanwhile, Bitcoin’s futures open interest has reached its highest level since April 2022, standing at $16.3 billion. This milestone gains even more significance as the Chicago Mercantile Exchange solidifies its position as the second-largest market for BTC derivatives.
Healthy demand for Bitcoin options and futures
The recent use of Bitcoin futures and options has made media headlines. The demand for leverage is likely fueled by what investors believe are the two most bullish catalysts for 2024: the potential for a spot BTC ETF and the Bitcoin halving.
One way to gauge market health is by examining the Bitcoin futures premium, which measures the difference between two-month futures contracts and the current spot price. In a robust market, the annualized premium, also known as the basis rate, should typically fall within the 5%–10% range.

Notice how this indicator has reached its highest level in over a year, at 11%. This indicates a strong demand for Bitcoin futures primarily driven by leveraged long positions. If the opposite were true, with investors heavily betting on Bitcoin’s price decline, the premium would have remained at 5% or lower.
Another piece of evidence can be derived from the Bitcoin options markets, comparing the demand between call (buy) and put (sell) options. While this analysis doesn’t encompass more intricate strategies, it offers a broad context for understanding investor sentiment.
Related: Bitcoin Ordinals see resurgence from Binance listing
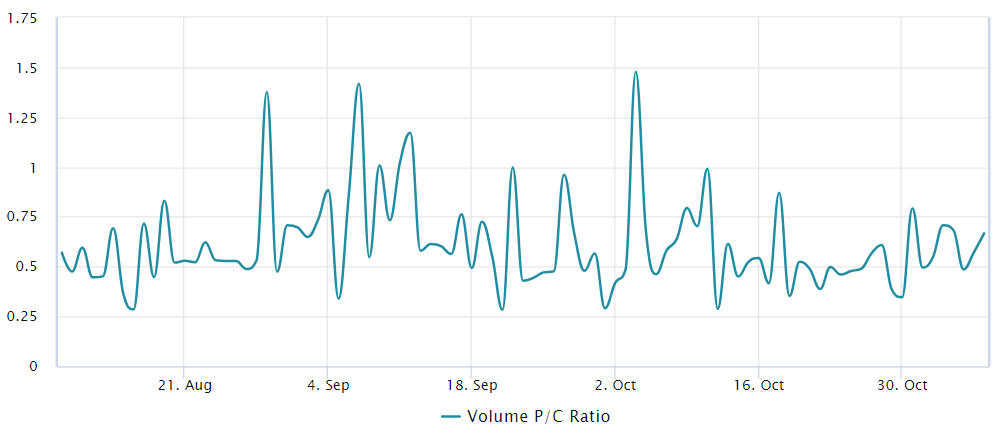
Over the past week, this indicator has averaged 0.60, reflecting a 40% bias favoring call (buy) options. Interestingly, Bitcoin options open interest has seen a 51% increase over the past 30 days, reaching $15.6 billion, and this growth has also been driven by bullish instruments, as indicated by the put-to-call volume data.
As Bitcoin’s price reaches its highest level in 18 months, some degree of skepticism and hedging might be expected. However, the current conditions in the derivatives market reveal healthy growth with no signs of excessive optimism, aligning with the bullish outlook targeting prices of $40,000 and higher by year-end.
This article is for general information purposes and is not intended to be and should not be taken as legal or investment advice. The views, thoughts, and opinions expressed here are the author’s alone and do not necessarily reflect or represent the views and opinions of Cointelegraph.
Amid market turbulence, OKX and Bitstamp reflect Bitcoin’s volatile exchange climate
Quick Take
In the face of contemporary geopolitical instability and market unpredictability, Bitcoin exchanges are experiencing intense volatility in their inflows and outflows.
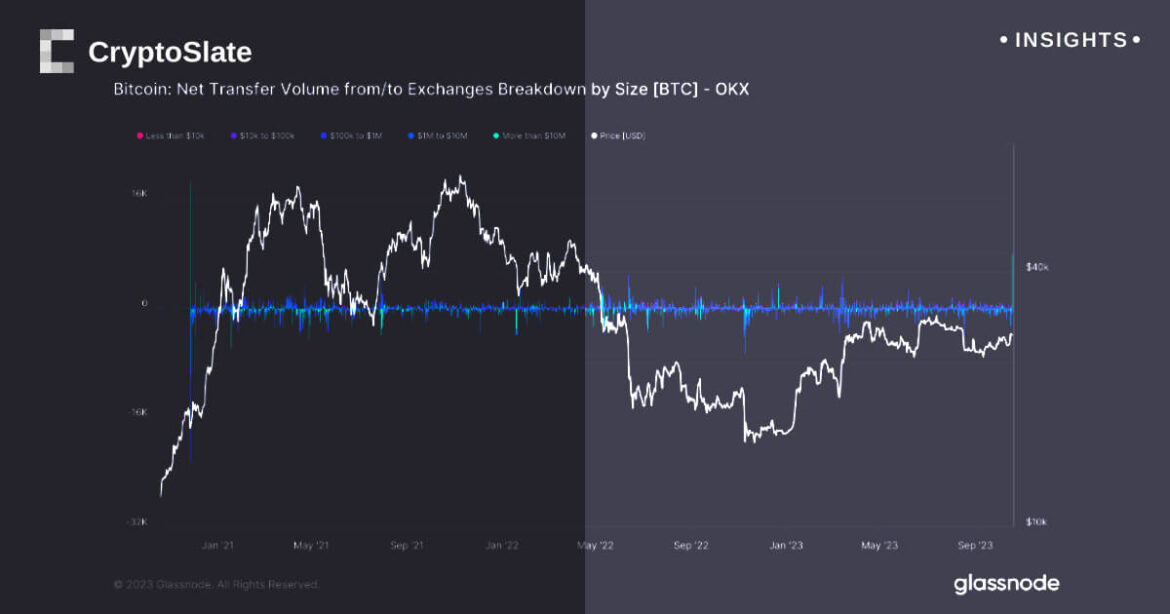
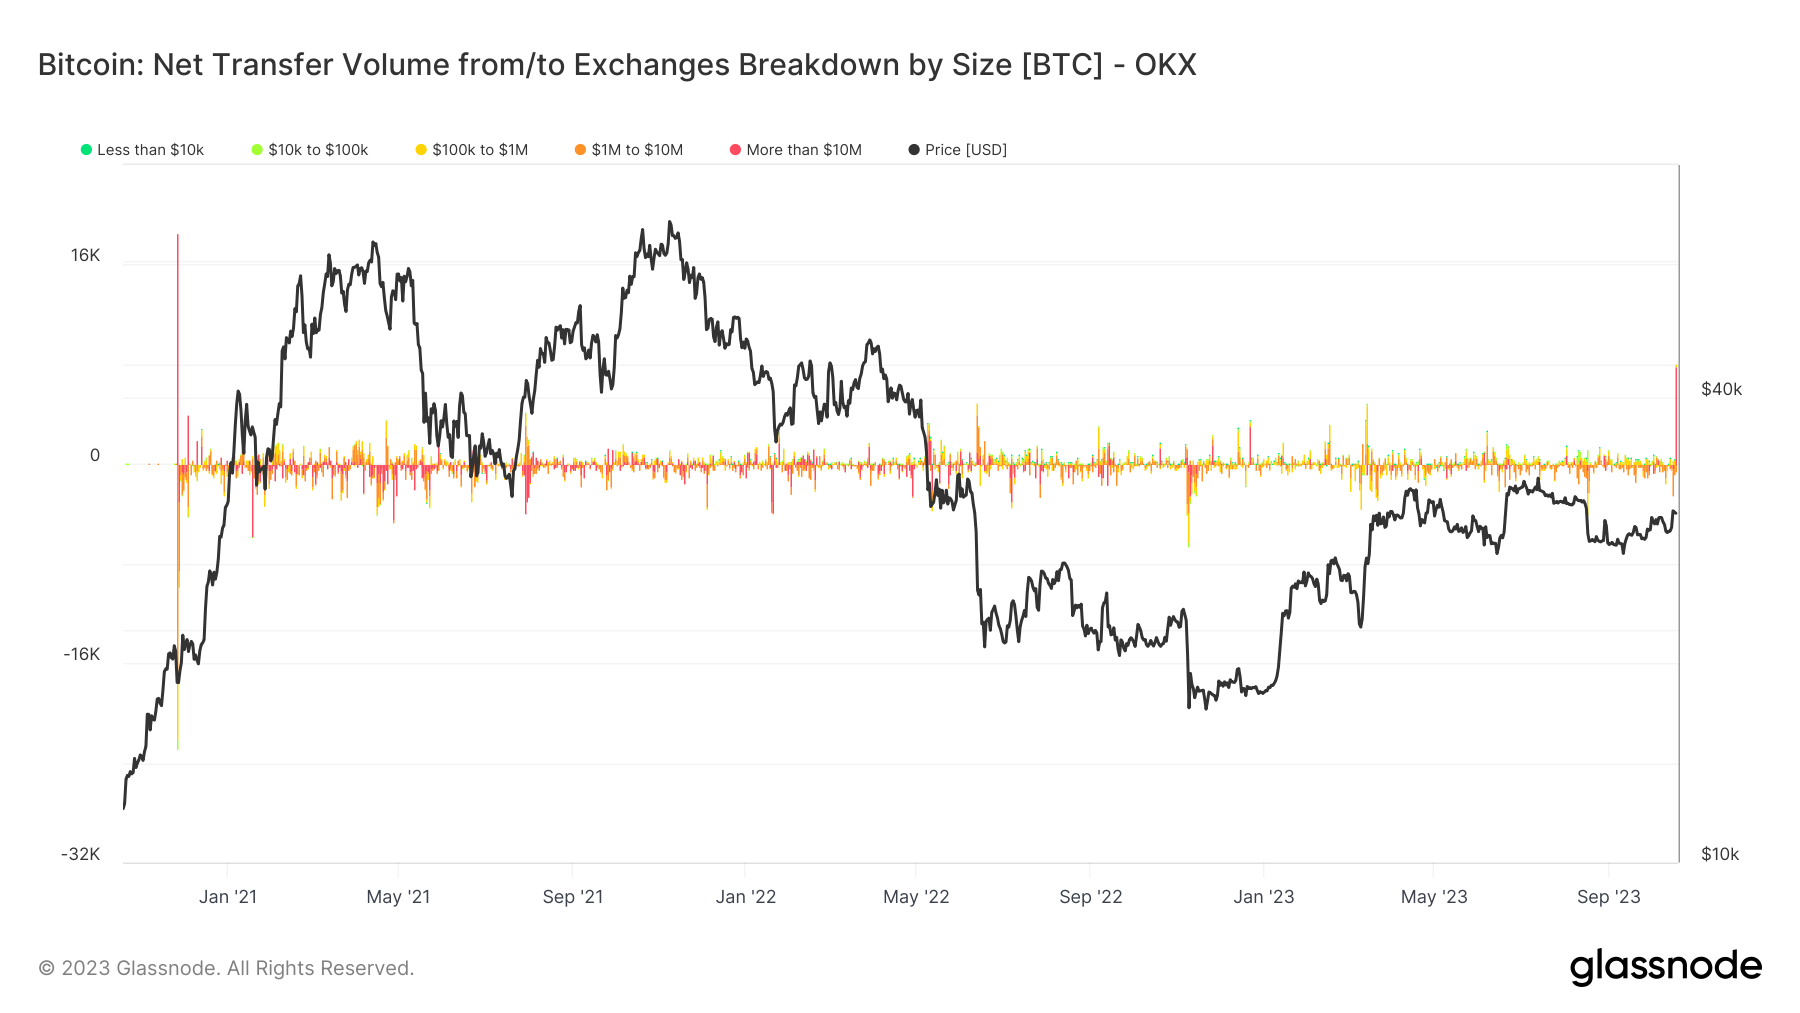
OKX Exchange, for instance, yesterday, Oct. 18, saw the largest Bitcoin inflow in almost three years, with approximately 8,000 Bitcoin valued at around $224 million.
Interestingly, this significant inflow is the largest since Nov. 2020, a period that also coincided with OKX’s largest outflow in the past three years. This simultaneous event of large inflows and outflows draws attention to Nov. 2020 as the inception of the previous cycle’s bull run.
Presently, OKX holds a year-to-date high of approximately 143,000 Bitcoin, the most since January 2021.
Conversely, Bitstamp Exchange has witnessed the largest outflow in over a year, with about 5,000 Bitcoins, equivalent to approximately $140 million. Currently, Bitstamp has about 40,000 Bitcoins on their platform, the lowest level since 2013.
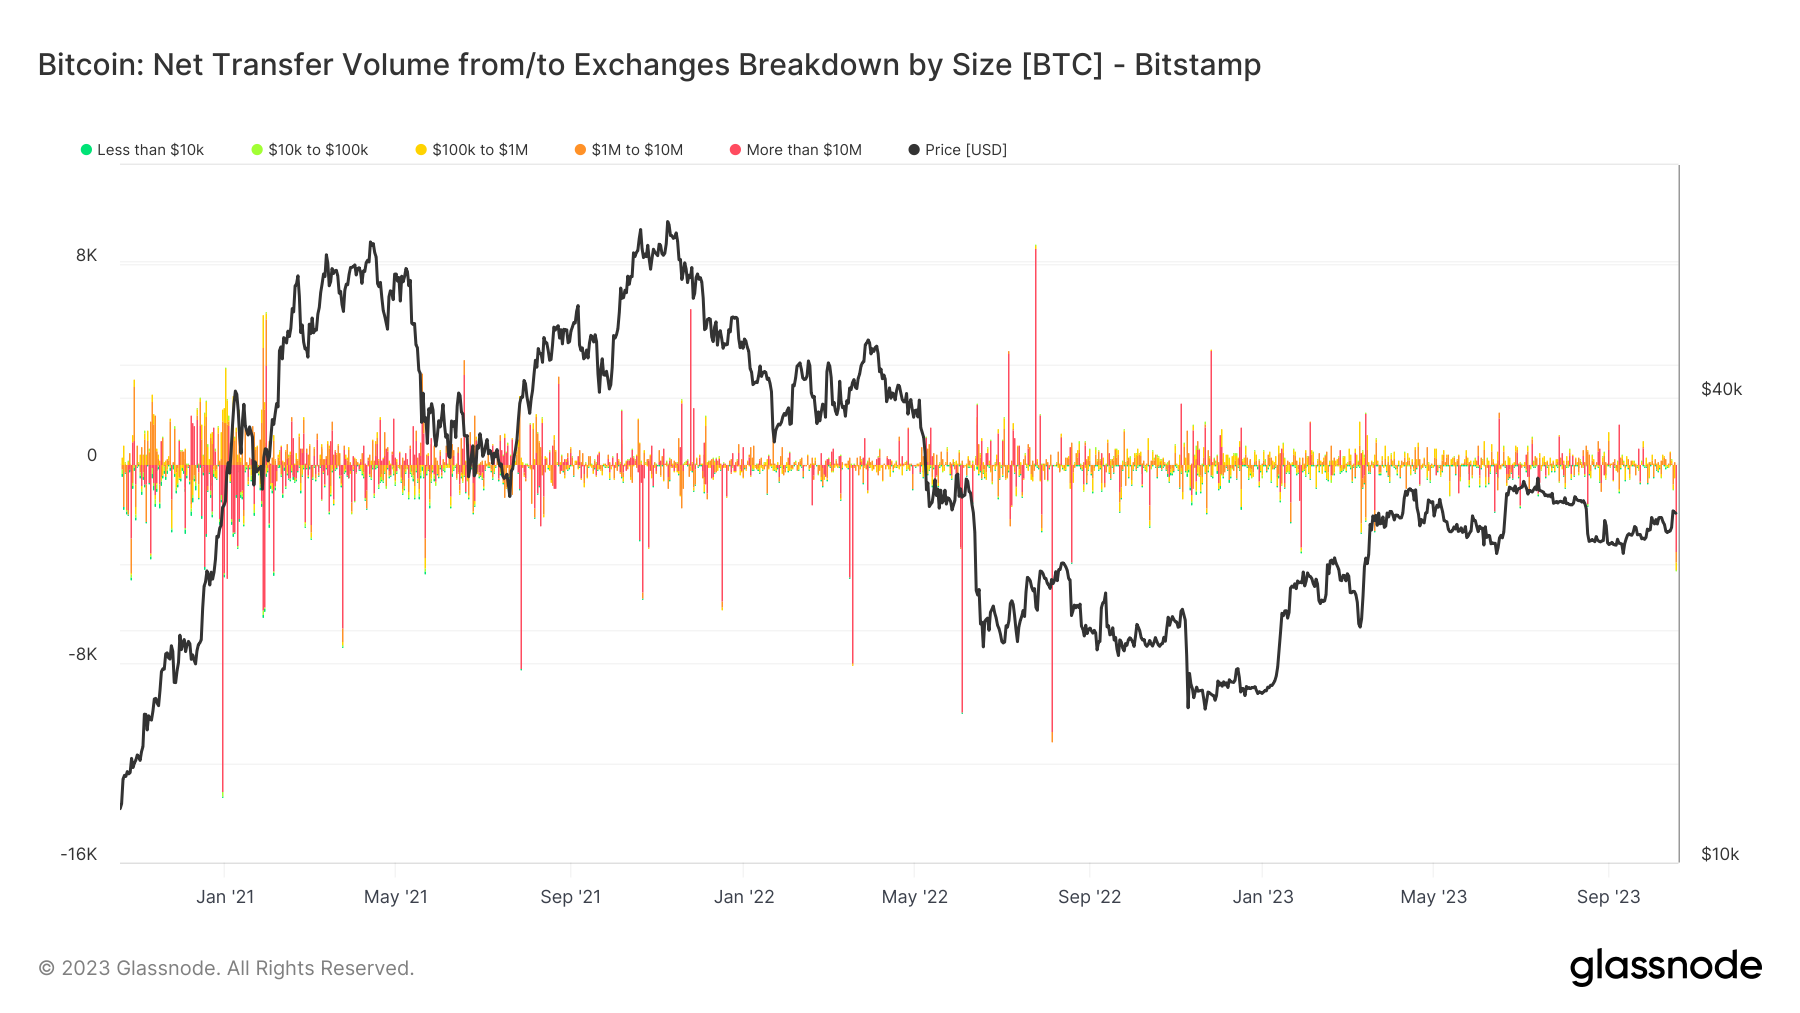
These contrasting observations underscore not only the unpredictable nature of Bitcoin exchanges but also the divergent strategies of individual platforms amidst the ongoing market volatility.
The post Amid market turbulence, OKX and Bitstamp reflect Bitcoin’s volatile exchange climate appeared first on CryptoSlate.
Solana (SOL) has found itself under the shadow of a foreboding technical pattern known as the “Death Cross.” This ominous occurrence, defined by the 50-day moving average crossing below the 200-day moving average, has historically heralded significant price downturns.
Investors are now eyeing the charts as SOL grapples with this pattern once again, raising questions about its future trajectory.
For the uninitiated in the intricacies of technical analysis, the Death Cross is akin to a storm warning on the horizon. It emerges when a short-term moving average dives beneath a long-term moving average, signaling potential tumult ahead.
The last instance when Solana encountered the Death Cross was back in 2022, and the aftermath was far from favorable – a considerable downtrend that sent ripples through the crypto market.
Fast forward to the present, and Solana finds itself at a crossroads once more. As of now, SOL is valued at $20.84 according to CoinGecko, reflecting a 1.4% gain over the last 24 hours.
However, a more concerning figure emerges when considering the seven-day performance, which showcases an 11.1% slump. These numbers underscore the significance of the pending death cross and the apprehensions it invokes.
SOL market cap at $8.4 billion on the daily chart: TradingView.com
Bearish Solana Trends And Lingering Uncertainties
Analyzing the market structure on the 1-day chart reveals a bearish picture for SOL. The cryptocurrency recently established a lower high at $25.68 coupled with a lower low at $22.23 on August 5.
Subsequent weeks witnessed the gradual formation of a downtrend, amplifying concerns among traders and investors. Further technical indicators add weight to the concerns.
The On-Balance Volume (OBV) has been painting a discouraging narrative as well, with declining demand for SOL evident through the formation of lower highs since mid-July.
The Relative Strength Index (RSI) depicts a recent bearish momentum, hinting at potential further declines. Additionally, the moving averages stand on the cusp of signaling a dip, adding to the prevailing unease.
Meanwhile, bearish mood prevailed in the market, based on Open Interest. Even though SOL was at long-term support, the drop in OI over the last 10 days was significant, and it has not reversed the downturn.

Source: Coinglass
Potential Impact On Investor Sentiment And TVL
Despite Solana’s current Total Value Locked standing at a noteworthy $243.85 million, the looming death cross looms as a destabilizing factor. Past experiences have shown that such ominous patterns can erode investor sentiment, potentially leading them to seek safer investment options.
Consequently, the TVL could face downward pressure as investors contemplate safeguarding their capital amidst uncertain times.
As the crypto community holds its breath, the coming weeks will undoubtedly be critical for Solana. Traders and investors will closely watch for signals of whether history will repeat itself, or if SOL will manage to defy the ominous prophecy of the death cross and forge a different path.
(This site’s content should not be construed as investment advice. Investing involves risk. When you invest, your capital is subject to risk).
Featured image from Getty Images
Receive free The QE retreat updates
We’ll send you a myFT Daily Digest email rounding up the latest The QE retreat news every morning.
The Federal Reserve’s drive to shrink its swollen balance sheet is poised to hit $1tn this month, a significant milestone in the US central bank’s attempt to reverse years of easy pandemic-era monetary policy as investors warn further reductions threaten to shake financial markets.
The US central bank bought trillions of dollars of government bonds and mortgage-backed securities to help stabilise the financial system during the early stages of the Covid-19 pandemic, but last spring started letting its holdings mature without replacing them.
As of August 9, the Fed’s portfolio had shrunk by $0.98tn since the portfolio’s peak of $8.55tn in May last year, and analysis of weekly data suggests it is on track to pass $1tn before the end of the month.
By removing one of the largest buyers from government bond markets, the Fed’s balance sheet reduction — known as quantitative tightening — adds to the supply of debt that private investors have to absorb.
For the central bank, quantitative tightening can be a precarious path. It was forced to end its previous attempt in 2019 after the balance sheet unwinding contributed to a sharp spike in borrowing costs that spooked markets.
So far, the latest round of tightening has proceeded smoothly, despite happening at almost twice the pace of 2018-2019 reductions. Investors say the resilience reflects the fact that the global financial system has been awash in cash since the pandemic, but the backdrop for further decreases is becoming more challenging.
“The second trillion worth of balance sheet reduction is likely to have more of an impact,” said Jay Barry, co-head of US rates strategy at JPMorgan. “The first trillion occurred against the backdrop of the federal funds rate moving rapidly higher, and the second trillion matters more because it’s coming against the backdrop of a quicker increase in the pace of Treasury supply.”
The Fed aims to cut another $1.5tn from its balance sheet by mid-2025, just as the US government is dramatically increasing the amount of debt it issues, and as demand from foreign investors wanes.
That threatens to drive up borrowing costs for the government and for companies, and would cause losses for the many investors who have piled into bonds this year expecting yields to fall as the cycle of interest rate rises draws to a close.

Manmohan Singh, a senior economist at the IMF, said a further $1tn of QT would be equivalent to lifting the federal funds rate by another 0.15 to 0.25 percentage points.
“With interest rates stabilising, the effects of more QT may be easier to see,” he said.
The Treasury department has ramped up bond issuance this year to fill the gap between lower tax revenue and higher government spending. Earlier this month, the agency announced that it would increase the sizes of its auctions in the coming quarter, and that there would be further increases in the quarters to come. Meghan Swiber, a rates analyst at Bank of America, estimates that some auction sizes could reach the peaks hit in 2021, at the height of Covid-19 borrowing.
Meanwhile, demand from Japan, the largest foreign holder of Treasury bonds, is forecast to fall. The Bank of Japan in July eased control on its government bond market, sending Japanese bond yields to the highest level in almost a decade. Higher bond yields have led some investors to anticipate a significant repatriation of Japanese money, with notable flows out of Treasuries.
QT, even in this scenario, is not expected to result in the sort of liquidity calamity seen in 2019. Unlike four years ago, there is still a lot of cash in the financial system. Although usage has come down, a special Fed facility designed specifically to suck up excess cash still has investors putting $1.8tn into it every night. Bank reserves are lower this year, but remain far above the levels at which the Fed starts to worry.
But some analysts think yields in the Treasury market could go up significantly, particularly on longer-dated bonds. Higher yields reflect lower prices.
“The Fed’s unwind, even though it’s passive, should lead to a steeper yield curve,” Barry said.
“Even though we’re done with rate hikes, [QT] could influence the yield curve for the rest of this year and into next year as well.”
Because Treasury yields underpin valuations across asset classes, a significant rise would also mean higher costs for corporate borrowers and could undermine the rally in equities this year.
“All of this shuffles around the buyers and the sellers and the market,” said Scott Skyrm, a repo trader at Curvature Securities. “And, of course, when you move things around, it tends to create more volatility. I expect more volatility in September and October, as a lot more issuance comes.”
Options implied volatility drops but market still expects turbulence
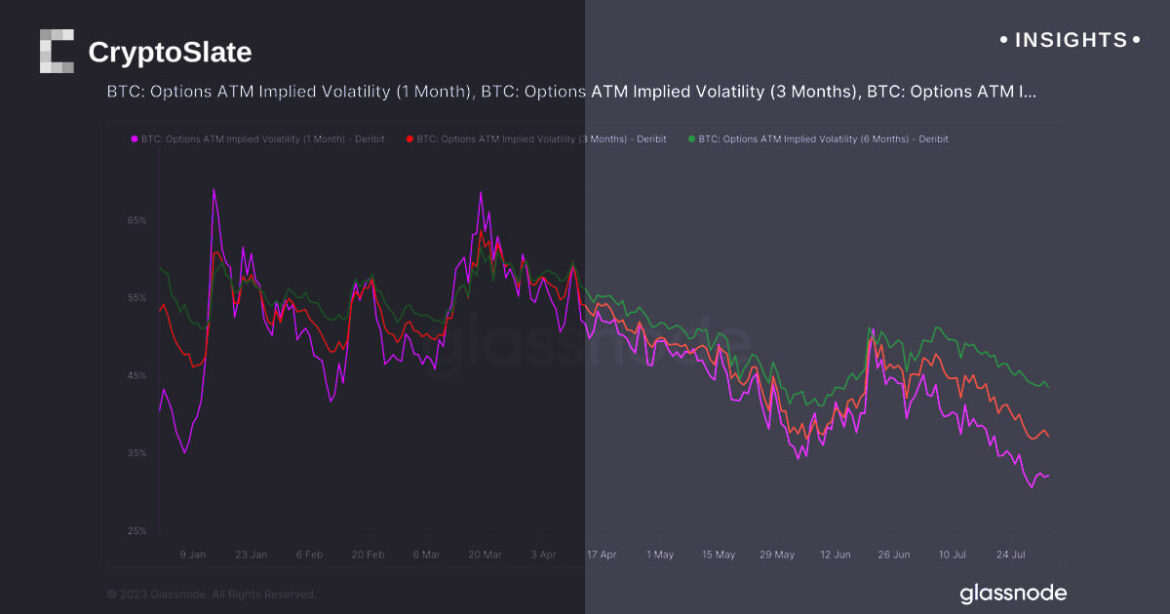
The implied volatility (IV) for Bitcoin options decreased significantly in July.
The IV for Bitcoin options on Aug. 3 is as follows:
| Expiry Period | Percentage |
|---|---|
| 1-Month Expiry | 32.73% |
| 3-Month Expiry | 37.78% |
| 6-Month Expiry | 44.07% |
Implied volatility is a metric that represents the expected percentage change in the price of Bitcoin over a year, with a 68% probability. Essentially, it represents the market’s expectation of Bitcoin’s volatility over the duration of the option.
The increasing IV for longer-dated Bitcoin options suggests that the market is expecting greater price uncertainty or volatility in the longer term. This pattern is known as “volatility skew.”
However, the decrease in IV in July indicates that the market’s expectation of Bitcoin’s price volatility has reduced for the near term.

The post Options implied volatility drops but market still expects turbulence appeared first on CryptoSlate.
“Now Boarding” is a videocast about air travel and the business of flying. CNBC airlines reporter Leslie Josephs and CNBC senior producer Erin Black delve into topics like turbulence, airline status, boarding, jumbo jets and all things aviation. Watch this episode and others on CNBC’s YouTube channel.
On this episode of “Now Boarding” Leslie and Erin discuss turbulence: what causes it, whether it’s getting worse and why it’s usually nothing to worry about. While serious injuries from turbulence are rare, it’s always important to follow crew safety instructions.


