
Ethereum’s native token Ether (ETH) is down almost 7% today due to a mix of fundamental and technical factors.
Fed’s hawkishness dampens Ethereum price
On June 15, the price of Ether dropped 1.7% to around $1,620, its lowest level in three months. The ETH price intraday decline came as a part of a broader weekly downtrend accelerated by the Federal Reserve’s hawkish tone a day ago.
The U.S. central bank left the benchmark interest rates unchanged due to cooling inflation. But its chairman, Jerome Powell, asserted that they would hike rates more than investors had expected in 2023, all until the consumer prices drop meaningfully and significantly.
ETH’s price has declined by approximately 7.5% since Powell’s statement.
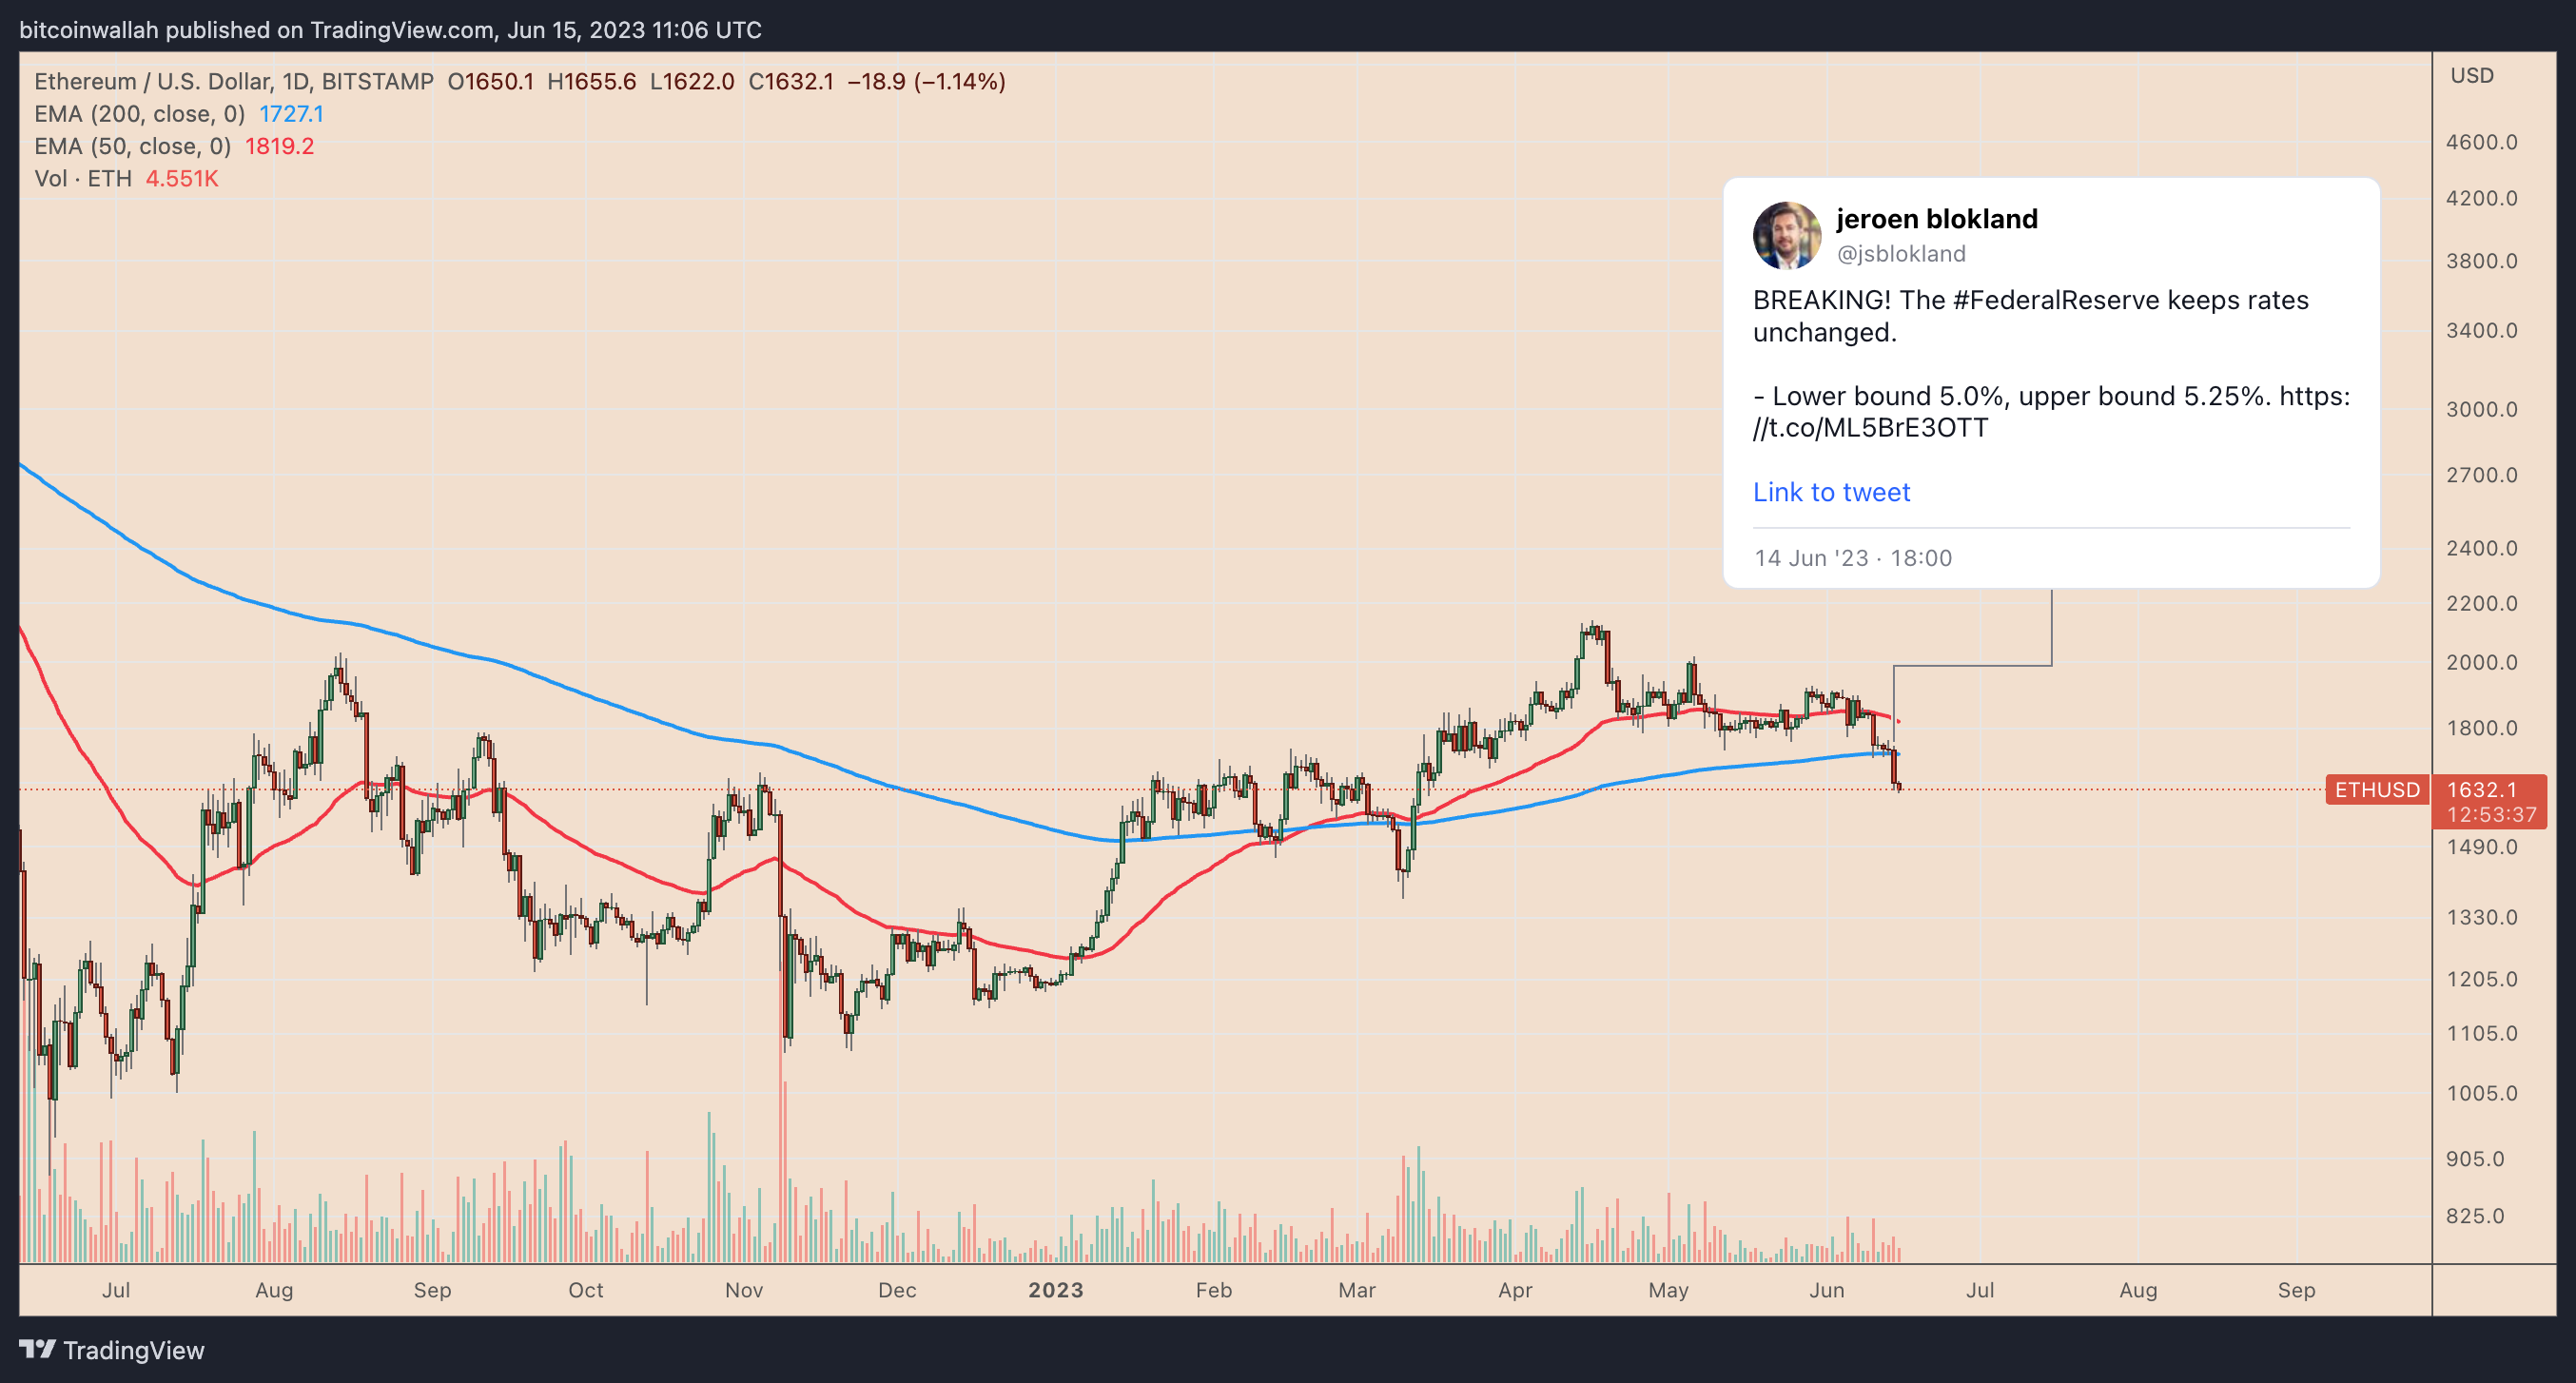
In recent years, Ether has behaved like a riskier asset, showing a strong positive correlation with the U.S. stock indexes. On June 14 and 15, as well, the Ethereum token dropped in tandem with the S&P 500, the Nasdaq Composite, and the Dow Jones.
Ether’s price decline in the last 24 hours has also triggered a wave of leveraged long liquidations that reached $54.95 million on June 15, the highest among the top-ranking crypto assets, according to Coinglass.
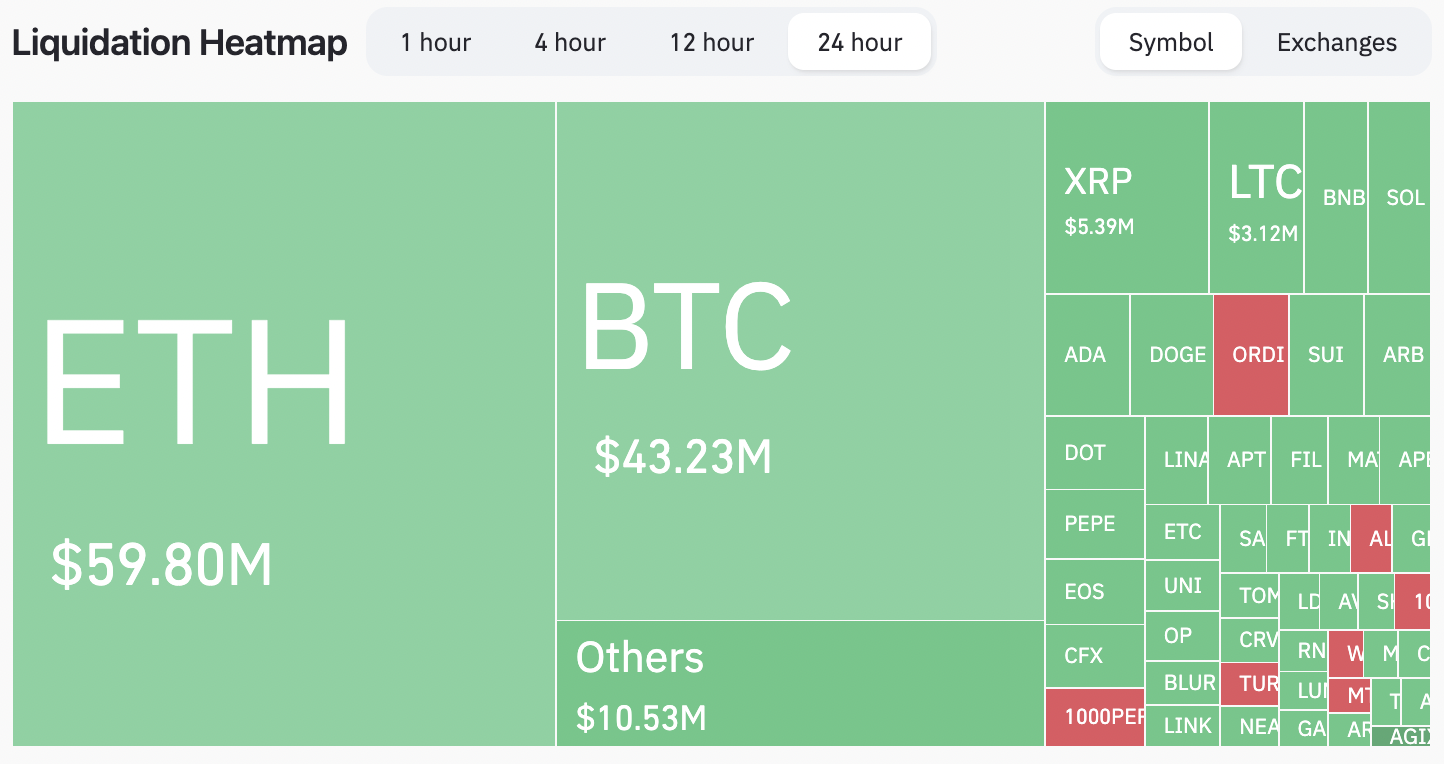
Meanwhile, the open interest of Ether-tied contracts dropped from nearly $6 billion on June 14 to $5.69 billion on June 15. In other words, long traders closed their positions by selling ETH, which may have accelerated the price drop.
ETH price breaks below key support
Ether’s selloff on May 15 accelerated due to the price losing a key support confluence comprising multi-month ascending and horizontal trendlines and a 200-day exponential moving average (200-day EMA; the blue wave) near $1,750.

However, ETH/USD has the potential to recover a portion of its recent losses in June, given its daily relative strength index (RSI) has dropped below 30 — an “oversold” area that typically precedes a rebound or consolidation.
Ether’s longer-timeframe chart also hints at a potential recovery ahead. Notably, the ETH/USD pair is still treading above its 200-week EMA (the blue wave) near $1,600 — a psychological support level since March 2023.
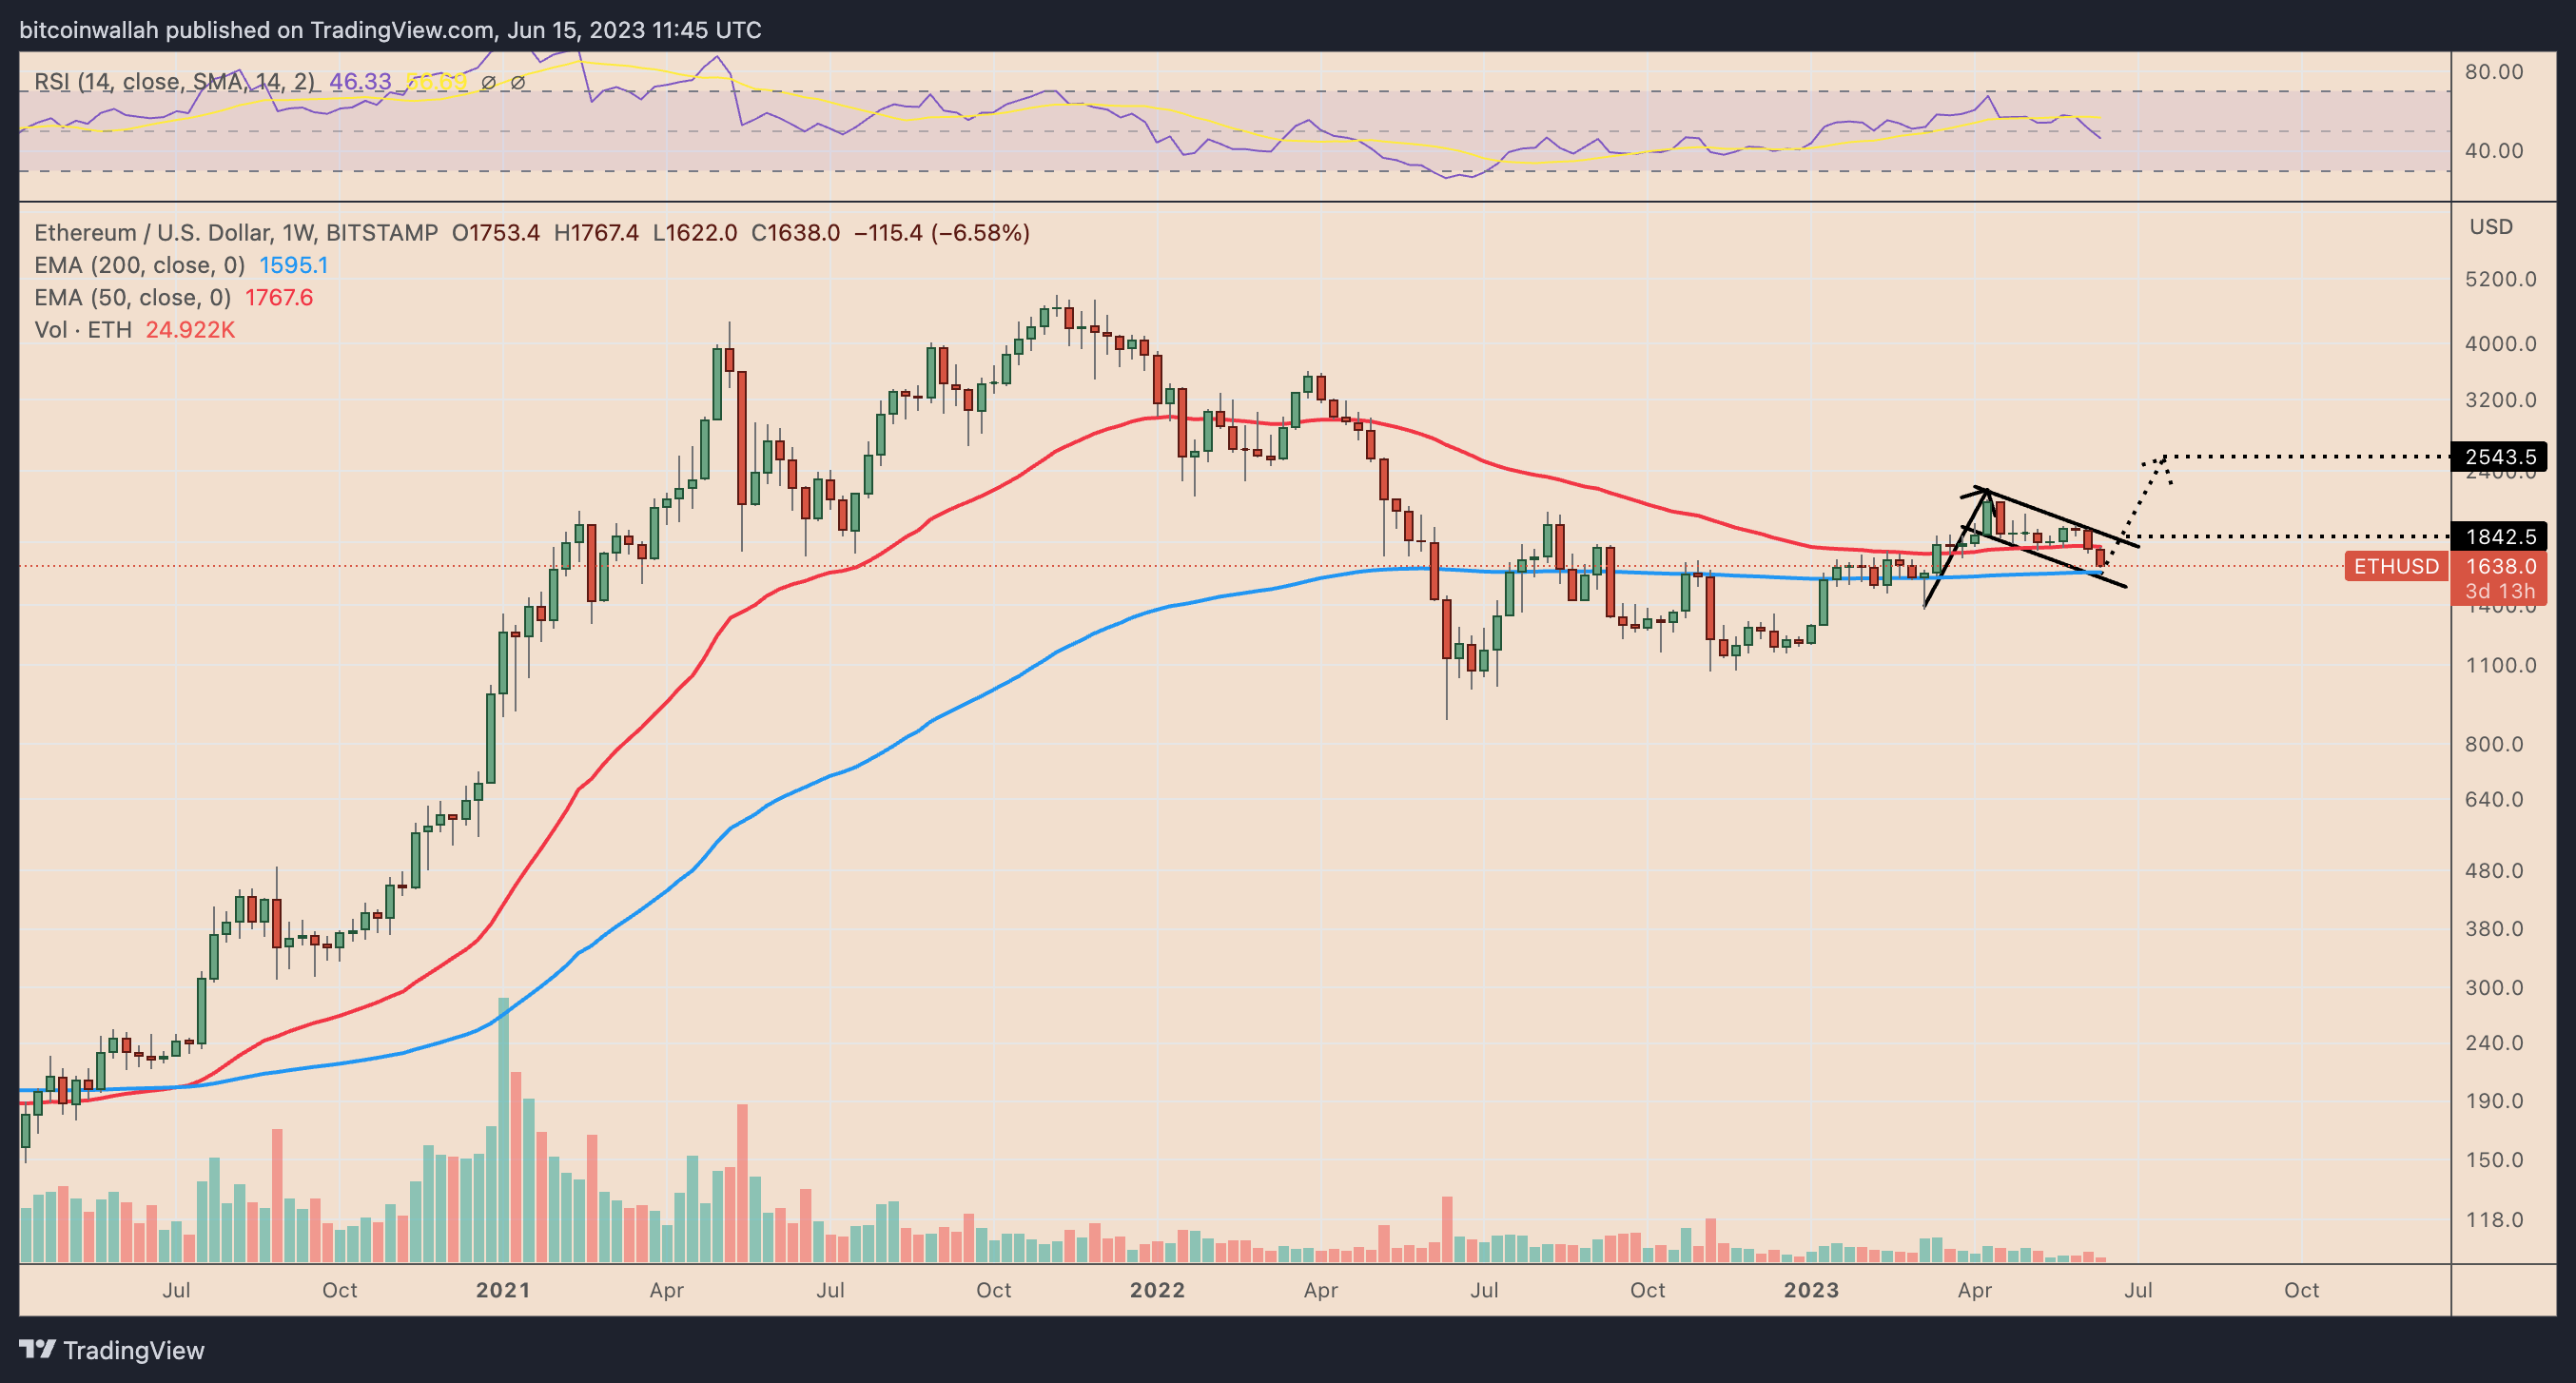
The 200-day EMA support coincides with the lower trendline constituting what appears to be a bull flag.
Therefore, Ether’s likelihood to rise toward the flag’s upper trendline near $1,850 is high on a decisive rebound from the lower one — which would be an approximately 15% jump from current prices.
Meanwhile, a break above the flag’s upper trendline could have the ETH price reach $2,500 in 2023 as its next upside target.
Related: Curve pool imbalance triggers USDT depeg concerns, Tether CTO calls it FUD
Conversely, the bearish scenario will be a drop below the flag’s lower trendline. This could further pull down ETH price, particularly toward the Q1 support range of $1,400-1,450.
This article does not contain investment advice or recommendations. Every investment and trading move involves risk, and readers should conduct their own research when making a decision.